


- HDFC Bank rose to a three-month high near Rs 817.
- Support Rs 800; low Rs 669.20.
- RSI 74 signals a possible pause.
InvestingCube chart · Yahoo Finance data
HDFC Bank shares are showing signs of life. On November 11th, the share price increased by approximately 2.5% to reach Rs. 817.75, which was a three-month high. The share price has increased by over 10% in the last seven days. This is a very significant move for India’s largest private bank. Is this the beginning of the rally, or is it running out of steam? Let us look at what we know about this. Take a look at the chart.
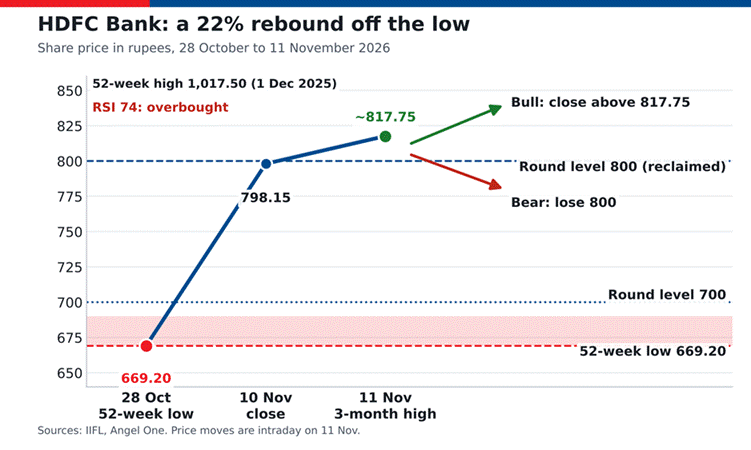
Figure 3: HDFC Bank share price and key levels in the bank’s blue and red. Data to 11 November 2026.
Reading the Chart
The stock’s 52 week low was made on October 28th and was Rs 669.20. The stock then moved upward, closing at Rs 798.15 on November 10th. The following day the stock traded as high as Rs 817.75, which is represented by the green dot. This represents a 22 percent increase in value over the course of two weeks. It should be noted that such rapid increases in value are unusual for large banks. The pink band represents the area of previous lows. Additionally, the stock has recently crossed above the 800 level (dashed line), and is approaching the 700 level (dotted line). While the stock has seen significant gains since hitting its 52-week low, it remains well below its 52-week high of Rs 1,017.50 that occurred during December 2025.
The wider market helped too, as our Sensex report explains.
What Is Driving It
Q2 results were steady. Profit rose 4.7% to about Rs 19,510 crore. Net interest income grew about 9.7%. Gross bad loans fell to 1.11%. Deposits rose 18.8%. Retail lending is also strong. Disbursements beat Rs 90,000 crore in the quarter. That helps future profit. You can read the full numbers on the HDFC Bank investor page. Analysts think the net interest margin may have bottomed in Q2.
Leadership news helped too. Changes at the top are under way. News of Anup Bagchi’s appointment eased worries about governance. Foreign money also came back. Investors bought nearly $6 billion of Indian stocks in November. HDFC Bank is one of the biggest names in the Nifty. Learning to weigh news like this is part of our guide on how to pick stocks.
What Could Go Wrong
Be careful. The RSI is 74. That is overbought. Rallies like this often pause. The stock is still 20% below its high. Trends take time to change. The liquidity coverage ratio is 113%, and the credit-deposit ratio is 96%. Both could limit lending growth. Check live prices on the NSE. To see where traders place bets, read our option chain analysis guide.

Three Scenarios
- Bullish: a close above Rs 817.75 extends the rally.
- Bearish: a close below Rs 800 hands control back to sellers.
- Neutral: a pause between Rs 800 and Rs 817.75.
Short term, expect a pause after such a fast run. Long term, margins and deposits matter most. Rules for banks come from the Reserve Bank of India. Our guide to fundamental analysis shows which numbers to check. The stock is still down about 18% this year. Set a stop loss. Never risk money you cannot afford to lose. Do not chase a rising price. This is education, not advice. Would you buy now, or wait for a dip to 800?
Frequently Asked Questions
Why is HDFC Bank stock rising?
The fact that the second quarter results were steady, that there is optimism regarding the margin having hit bottom, that the concerns over corporate governance are being reduced, and that foreign investors are purchasing Indian stocks is supporting the market.
What is the key HDFC Bank resistance?
Rs 817.75 was the last three months’ maximum value. If the price goes above Rs 817.75, there will be no immediate barrier to the price increasing up to the Rs 1,017.50 maximum value.
Where is HDFC Bank support?
The first level of support is Rs 800. Below that, there are two other support levels: Rs 700 (round level) and Rs 669.20 (low).
What is your outlook on HDFC Bank?
Anonymous · no sign-up · results from the last 30 days · not investment advice