


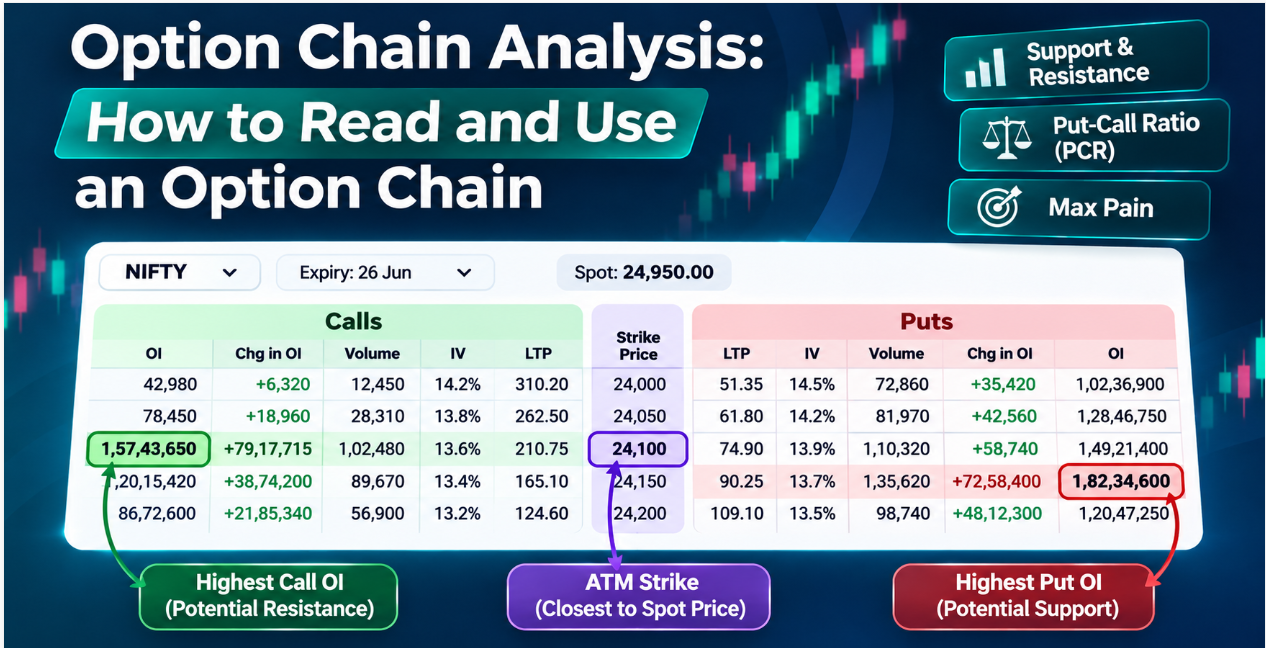
An option chain is a table listing available call and put option contracts for an underlying asset, organised by strike price and expiry date. It shows important trading information, including option premiums, open interest, trading volume and implied volatility, allowing traders to compare market activity across different strike prices.
Option chain analysis is widely used in index and stock options trading, particularly in markets such as India’s National Stock Exchange (NSE). Traders examine the data to identify where options positions are concentrated, assess changes in market participation and estimate potential support and resistance levels.
However, an option chain does not directly predict whether an index or stock will rise or fall. Open interest reflects outstanding contracts, not the directional intentions of individual traders, while support and resistance levels inferred from options data can change throughout the session.
This guide explains how to read an option chain, interpret its key columns and use Nifty option chain data in a practical trading example.
Key Takeaways
- An option chain displays call and put contracts across different strike prices and expiry dates, together with premiums, open interest, volume and other market data.
- Traders often examine the highest call open interest for potential resistance and the highest put open interest for potential support, although these levels are not guaranteed.
- Changes in open interest show whether outstanding positions are increasing or decreasing, but do not independently reveal whether traders are bullish or bearish.
- The Put-Call Ratio (PCR) and max pain provide additional information about options positioning, but neither is a reliable standalone price prediction tool.
- NSE option chain analysis is most useful when combined with price action, market structure, implied volatility and disciplined risk management.
What Is an Option Chain and What Does It Show?
An option chain is a structured list of options contracts available for a particular underlying asset, such as a stock, exchange-traded fund or market index. Each contract gives its buyer a specific right associated with the underlying asset, subject to the contract’s terms.
A call option gives the buyer the right, but not the obligation, to buy the underlying asset at a specified strike price. A put option gives the buyer the right, but not the obligation, to sell it at a specified strike price. For cash-settled index options, such as Nifty 50 index options, settlement is based on the contract’s cash-settlement rules rather than physical delivery of the index.
Option chains organise these contracts according to their strike prices and expiry dates.
Core Layout Matrix & Column Breakdown
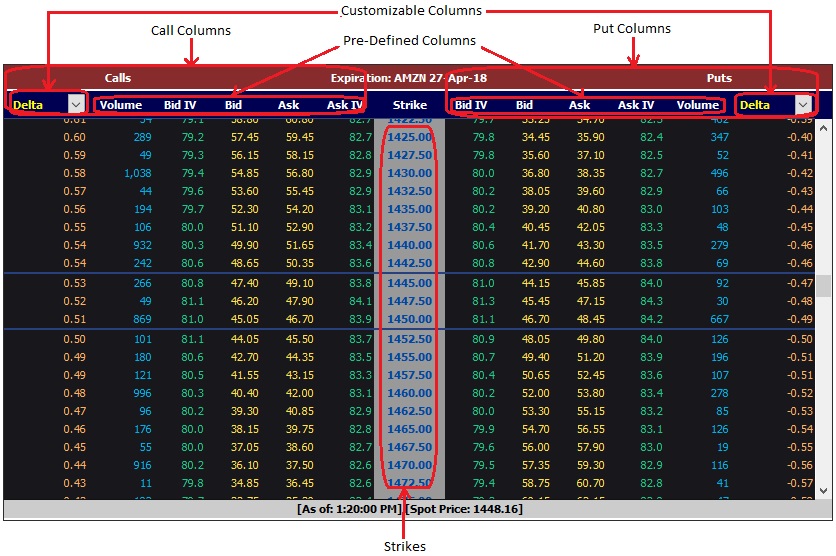
- Call Options (Left Side): Contracts giving the buyer the right to buy the underlying asset. Columns typically display Bid, Ask, Last Traded Price (LTP), Volume, and Open Interest.
- Strike Prices (Center Column): The predetermined prices at which contracts can be exercised, arranged in ascending order.
- Put Options (Right Side): Contracts giving the buyer the right to sell the underlying asset. Columns mirror the call side with Bid, Ask, LTP, Volume, and Open Interest.
- Expiration Selection (Header): A dropdown menu allowing traders to toggle between weekly, monthly, and quarterly contract expirations.
How to Read an Option Chain: Strike Price, Premium, Open Interest, and Volume
Learning how to read an option chain begins with understanding the columns and what each measurement represents. Although different trading platforms use slightly different layouts, most display the same core information.
Understanding the main option chain columns
| Column | What it tells traders |
|---|---|
| Strike Price | The price specified in the option contract |
| OI (Open Interest) | Total outstanding contracts |
| Chg in OI | Increase or decrease in outstanding contracts |
| Volume | Number of contracts traded during the session |
| IV (Implied Volatility) | Market-implied expectations of future volatility |
| LTP (Last Traded Price) | Price of the most recent transaction |
| Bid | Highest displayed price buyers are willing to pay |
| Ask | Lowest displayed price sellers are willing to accept |
The official NSE option chain includes these fields on both the call and put sides, along with additional information such as bid and ask quantities and changes in option prices.
Strike price and option premium
The strike price is the predetermined price specified in an options contract.
Suppose the Nifty 50 index is trading at 24,950. A trader examining the option chain may find contracts with strike prices of 24,900, 24,950 and 25,000.
The 24,950 strike is at the money (ATM) because it is closest to the current index level.
For call options, strikes below the current index price are in the money (ITM), while strikes above it are out of the money (OTM). The opposite applies to put options.
The option premium is the market price of the contract, commonly displayed under LTP.
For example, if a Nifty 25,000 call option has an LTP of ₹120, the quoted premium is ₹120 per index unit. The total premium paid depends on the applicable contract lot size.
Option premiums are influenced by the underlying price, time remaining until expiry, implied volatility and other pricing factors.
Open interest and change in open interest
Open interest is one of the most closely watched measurements in option chain analysis.
It represents the total number of outstanding option contracts that have not been closed, exercised or expired.
For example, if the Nifty 25,000 call option has open interest of 150,000 contracts, it means 150,000 contracts remain outstanding at that strike and expiry.
Every outstanding contract has both a buyer and a seller. Therefore, high call open interest does not necessarily mean that most traders are bearish, just as high put open interest does not automatically mean traders are bullish.
Change in Open Interest (Chg in OI) measures how the number of outstanding contracts has changed relative to the previous reference point, typically the previous trading session.
Suppose the 25,000 call option has the following data:
| Metric | Contracts |
|---|---|
| Previous open interest | 120,000 |
| Current open interest | 150,000 |
| Change in OI | +30,000 |
The increase of 30,000 contracts indicates that outstanding positions have grown.
However, it does not reveal whether the new positions were initiated primarily by buyers or sellers. A new options contract requires both sides of a transaction.
Similarly, falling open interest indicates a net reduction in outstanding contracts, but it does not independently identify whether bullish or bearish traders are closing their positions.
Traders therefore examine changes in OI alongside option premiums, underlying price movements and trading volume.
Trading volume versus open interest
Volume and open interest measure different aspects of options activity. Trading volume counts the number of contracts traded during a session, while open interest measures contracts that remain outstanding.
For example, an option could record trading volume of 250,000 contracts during the day while maintaining open interest of only 80,000 contracts. This can happen because contracts may change hands repeatedly or be opened and closed during the same session. High volume indicates active trading, but it does not necessarily mean that new positions are accumulating.
A contract with high open interest but very little trading volume may have substantial outstanding positions without attracting much current activity.

Option Chain Analysis: How to Find Support and Resistance Levels
Institutional market participants predominantly write (sell) option contracts to capture premium. Because writers require significant capital and margin, their collective positioning heavily influences key price boundaries.
The Institutional Rules of OI
- Highest Call Open Interest = Resistance: Large call OI indicates heavy institutional short call positions. Sellers defend these strikes to prevent the asset from rising above the strike price.
- Highest Put Open Interest = Support: Large put OI indicates significant institutional short put positions. Sellers defend these strikes to prevent the asset from dropping below the strike price.
- Surging Change in OI: A sudden intraday spike in Chg in OI at a specific strike reinforces that level as a strengthening support or resistance boundary.
Worked Example: Interpreting Open Interest (Evergreen Numbers)
Consider an asset trading at a Spot Price of 100:
| Call OI | Call Chg in OI | Strike Price | Put OI | Put Chg in OI | Implied Market Structure |
| 145,000 | +22,000 | 105 | 32,000 | +4,000 | Major Resistance Level |
| 85,000 | +12,000 | 102 | 45,000 | +8,000 | Minor Resistance |
| 42,000 | +2,000 | 100 (Spot) | 48,000 | +5,000 | Current Fair Value / At-The-Money |
| 35,000 | +3,000 | 98 | 162,000 | +31,000 | Major Support Level |
| 18,000 | +1,000 | 95 | 78,000 | +9,000 | Key Secondary Support |
- Resistance Analysis: The 105 Strike displays the highest Call OI (145,000 contracts) and strong positive building (+22,000 Chg in OI). This identifies 105 as the primary overhead resistance wall.
- Support Analysis: The 98 Strike holds the largest Put OI (162,000 contracts) along with substantial new position creation (+31,000 Chg in OI). This confirms 98 as the primary downside support floor.
- Expected Range: The asset is statistically expected to trade within the 98 – 105 boundary for the current expiration cycle.
Put-Call Ratio (PCR) and Max Pain: What They Tell You
The Put-Call Ratio and max pain are two additional measurements commonly used in options analysis.
Both are derived from options market data, but they serve different purposes.
What is the Put-Call Ratio (PCR)?
The Put-Call Ratio compares put option activity with call option activity. PCR can be calculated using either open interest or trading volume, so traders should establish which version they are analysing.
For an open-interest-based PCR, the calculation is:
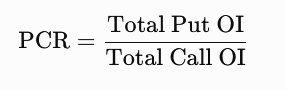
Suppose the total put open interest for a selected Nifty expiry is 1,200,000 contracts, while total call open interest is 1,000,000 contracts.
The PCR is 1.20.
This means there are 1.2 outstanding put contracts for every outstanding call contract in the selected dataset.
How to interpret PCR
| PCR | Basic interpretation |
|---|---|
| Below 1.0 | Call OI exceeds put OI |
| Equal to 1.0 | Call and put OI are equal |
| Above 1.0 | Put OI exceeds call OI |
Some traders interpret higher PCR readings as potentially bullish because they associate elevated put OI with put writing. Others interpret high PCR as evidence of bearish hedging demand.
Both interpretations are possible because every outstanding option has a buyer and a seller.
Therefore, there is no universally bullish or bearish PCR reading.
A PCR of 1.20 may have different implications depending on the underlying asset, historical positioning, volatility and the expiry being analysed.
What Is Max Pain in Options Trading?
Max Pain is the strike price at which the total payout to option buyers would be lowest if all outstanding call and put options expired at that price. In simple terms, it is the price level where option sellers would collectively have the least amount to pay out at expiry.
For example, if the Nifty option chain shows a Max Pain level of 25,000, some traders believe the index may move towards that level as expiry approaches. This is based on the theory that options-related trading and hedging activity can influence prices near expiration.
However, Max Pain is not a guaranteed price target. The level can change as traders open or close positions, and there is no guarantee that the market will move towards it. Traders should therefore use Max Pain alongside open interest, price action and other technical indicators rather than relying on it alone.
NSE Option Chain: Where to Find It and How to Use It
The National Stock Exchange of India (NSE) hosts one of the world’s most active derivatives markets. The official NSE option chain portal provides real-time data for equity indices and stock derivatives.
- Navigate to the Official NSE India Website: Visit the main portal at nseindia.com and locate the ‘Market Data’ tab. Select ‘Option Chain’ from the derivatives menu.
- Filter by Symbol and Expiry Date: Select your desired instrument, such as NIFTY, BANKNIFTY, or individual equity contracts, and choose the active weekly or monthly expiration series.
- Scan for Volume Concentration: Examine the Call OI column to spot ceiling resistance and the Put OI column to identify floor support.
- Track Intraday Changes: Observe intraday shifts. If call writers begin unwinding positions (negative Chg in OI) while put writers add aggressively, prepare for a bullish breakout above key resistance.
Nifty Option Chain: A Step-by-Step Analysis Example
Analyzing the Nifty option chain requires a multi-step systematic routine:
- Check the Spot Price: Identify where Nifty is trading relative to key round-number strikes.
- Locate At-The-Money (ATM): Focus on the 2–3 strike prices immediately above and below spot.
- Identify Support & Resistance: Scan out-of-the-money options to locate the strikes carrying the largest concentration of open contracts.
- Evaluate Implied Volatility (IV): Compare IV across calls and puts. High IV indicates elevated premium prices, favoring seller strategies, while low IV favors option buyers.
- Confirm with Chart Structures: Never base trade decisions solely on open interest. Confirm option chain support and resistance levels against technical chart patterns, trendlines, and candlestick signals.
Final Thoughts: How Useful Is Option Chain Analysis?
Option chain analysis helps traders understand how options activity is distributed across strike prices and expiry dates. By examining open interest, changes in OI, trading volume, premiums and implied volatility, traders can identify areas where market positioning is concentrated. For Nifty traders, the NSE option chain offers a structured way to monitor potential support and resistance levels and assess changes in derivatives market activity.
However, high open interest does not automatically indicate bullish or bearish sentiment, and options-based support and resistance levels are not guaranteed to hold.
The most practical approach is to use option chain analysis alongside price action, technical analysis and clearly defined risk management rules. This allows traders to evaluate options positioning without treating any single metric as a reliable prediction of future prices.
Also read: Smart Money Concepts: SMC and ICT Explained to learn how traders use liquidity, market structure and price action to identify potential trading opportunities.
Start by selecting the underlying asset and expiry date, then identify the strike price closest to the current market price. Compare call and put open interest, changes in OI, volume, premiums and implied volatility. Use the information to identify potential areas of interest, but confirm any trading setup with price action and risk management.
High open interest indicates that a large number of option contracts remain outstanding at a particular strike price and expiry. It suggests substantial positioning but does not reveal whether buyers or sellers are more aggressive. Traders often monitor these strikes as potential support or resistance areas, although the levels can change as positions are opened or closed.
A common method is to identify the strike with the highest put OI as potential support and the strike with the highest call OI as potential resistance, particularly around the current market price. Traders then monitor changes in open interest and compare these levels with price action. High OI does not guarantee that support or resistance will hold.
Option chain analysis can provide useful intraday information about options positioning, trading activity and potential price levels. However, its reliability varies with market conditions, liquidity and the strategy being used. Open interest changes throughout the session, and the data should not be used as a standalone entry or exit signal.
There is no universally ideal put-call ratio. A PCR above 1 indicates more put open interest or volume than call open interest, depending on the calculation, while a reading below 1 indicates the opposite. Its interpretation depends on historical levels, market conditions, expiry selection and whether traders are buying or writing options.