


- Fibonacci trading uses retracement levels like 38.2%, 50%, and 61.8% to help you spot where a pullback may end, and this guide shows how to draw them and build a simple strategy around them.
- Learn how to use Fibonacci retracement step by step, from picking the swing high and swing low to placing your entry, stop loss, and target.
- Fibonacci levels are not guaranteed to hold, but they work best when they line up with support, resistance, and moving averages.
Fibonacci levels look almost too tidy on a chart, which is why some traders rely on them and others dismiss them. The truth sits in the middle. Fibonacci trading cannot predict the market, but with a clear process it helps you spot where a pullback may end and a trend may resume. This guide covers the key ratios, how to draw retracement levels, and how to build a simple Fibonacci trading strategy.
What Is Fibonacci in Trading and Where Does It Come From?
Fibonacci in trading borrows from a number pattern introduced to Europe by the Italian mathematician Leonardo of Pisa, known as Fibonacci, in his 1202 book Liber Abaci. Each number in the sequence is the sum of the two before it: 0, 1, 1, 2, 3, 5, 8, 13, 21, 34 and so on. Early technical analysts applied its ratios to markets on the idea that crowd behavior moves in repeating proportions. Whether or not that theory holds, so many traders watch these levels that price often reacts to them anyway.
The Fibonacci Sequence and Key Ratios Used in Trading
The ratios in Fibonacci sequence trading come from dividing numbers in the sequence by each other. A number divided by the next one is about 0.618 (34 divided by 55). Divided by the number two places ahead, it is about 0.382. Three places ahead gives roughly 0.236. The 78.6% level is the square root of 0.618.
The 50% level is the odd one out. It is not a true Fibonacci ratio. It comes from Dow Theory, which noted that markets often retrace about half of a move. Nearly every platform includes it because traders watch it closely.
What Are Fibonacci Retracement Levels?
Fibonacci retracement levels are horizontal lines drawn between a swing high and a swing low. They mark how much of the prior move price might give back before the trend continues.
| Level | What it usually means |
| 23.6% | Shallow pullback, typical of strong trends |
| 38.2% | Moderate pullback and a common continuation zone |
| 50% | Midpoint, not a true Fibonacci ratio but widely used |
| 61.8% | Deep pullback, known as the golden ratio |
| 78.6% | Very deep pullback, with the trend close to failing |
How to Use Fibonacci Retracement: Step by Step
Knowing how to use Fibonacci retracement comes down to drawing it the same way every time.
- Confirm the trend. Check a higher timeframe to see whether the market is trending up or down.
- Pick the swing high and swing low. Use the most recent significant swing, not a minor wiggle inside it.
- Draw in the right direction. In an uptrend, drag from the swing low to the swing high. In a downtrend, drag from the high to the low.
- Read the levels. Treat each line as an area of interest, not an exact turning point.
- Wait for confirmation. Look for a reaction such as a bullish engulfing candle or a pin bar before you enter.
A worked example
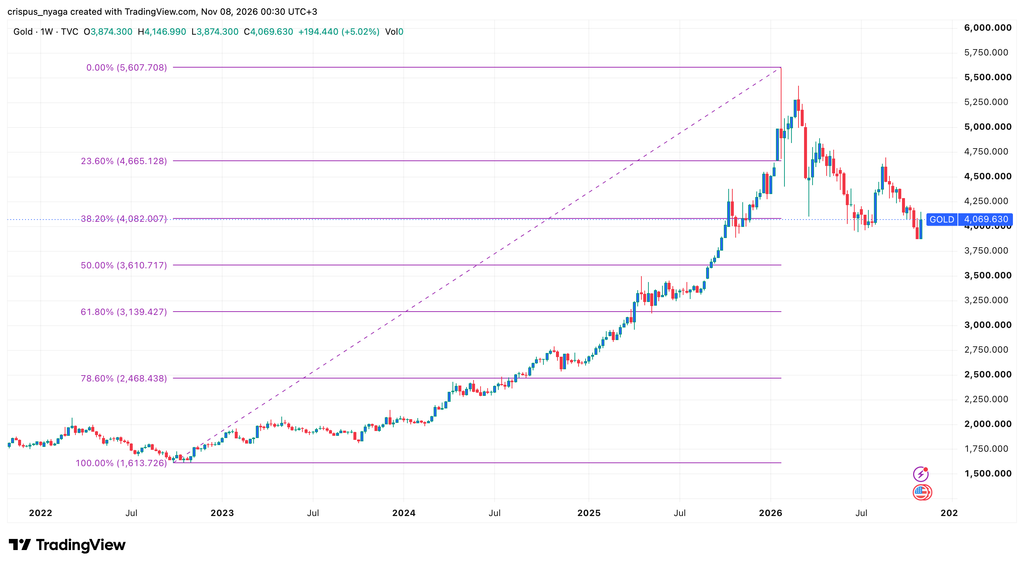
Here is an illustrative uptrend on gold on the weekly chart. The numbers are simplified for teaching and are not a trade recommendation.
The pair rallies from a swing low of $1,613 to a swing high of $5,60. Drawing the tool from low to high plots 38.2% at $4,069, 50% at $3,615, 61.8% at $3,145 and 78.6% at $2,468. Price slips through the first two with little reaction, then stalls near $4,069 and prints a bullish engulfing candle that closes at 1.0760. That is your confirmation.
Entry: buy at $4,082.

Take profit: $4,500, just below the 23.6% level.
Fibonacci Trading Strategy: Entries, Stop Loss, and Targets
A workable Fibonacci trading strategy needs a rule for the entry, the stop, and the exit.
- Entries. Most traders watch the 38.2%, 50% and 61.8% levels, the typical pullback range. Rather than placing a limit order on the line, many wait for a candlestick signal or a close back in the trend’s direction. You miss some trades this way, but you avoid many failed ones.
- Stop loss. Place it beyond the next Fibonacci level or the swing point, wherever your idea is clearly wrong. If you enter at 61.8%, a stop just past 78.6% is common. Our guide to Risk Management covers position sizing.
- Targets. The simplest target is the prior swing high or low. To aim beyond it, use extension levels at 127.2% and 161.8%. In the example, those project to about 1.1109 and 1.1247. Many traders take partial profits at the swing high and move the stop to break even.
Combining Fibonacci With Support, Resistance, and Other Indicators
One level is one opinion. When several tools agree, traders call it confluence, and the odds improve.
- Support and resistance. A 61.8% level sitting on a former resistance zone now acting as support carries more weight. See Support and Resistance.
- Moving averages. A pullback stalling at 50% right on the 50 or 200 period average is a stronger signal. See Moving Averages.
- Candles and momentum. A reversal candle, or RSI turning up from oversold at 61.8%, adds confirmation.
Fibonacci is one part of a wider toolkit, so start with technical analysis if you are still building yours. Be honest about the limits, too. Levels are not guaranteed to hold, and price sometimes slices through 61.8% as if it were not there. With enough lines on a chart, one will always look like it worked afterward. Use Fibonacci selectively, wait for confirmation, and know where you are wrong before you enter.
Frequently Asked Questions About Fibonacci Trading
What are the most important Fibonacci retracement levels?
The 38.2%, 50% and 61.8% levels, which cover the typical pullback range. The 23.6% level shows up in strong trends and 78.6% marks a deep pullback. Remember that 50% is not a true Fibonacci ratio.
How do you draw Fibonacci retracement correctly?
In an uptrend, draw from the swing low to the swing high. In a downtrend, draw from the swing high to the swing low. Use the latest significant swing and anchor to wicks consistently.
Does Fibonacci retracement really work?
It works as a way to organize your analysis, not as a prediction tool. Many traders watch the same levels, which can create reactions, but no level is guaranteed. It is most useful when it lines up with other signals and comes with a stop loss.
What is the best timeframe for Fibonacci trading?
There is no single best one. Higher timeframes such as the 4 hour and daily give cleaner swings and fewer false signals, while lower ones give more setups and more noise. Many traders find the swing on a higher timeframe and time entries on a lower one.
What is the difference between Fibonacci retracement and extension?
Retracements estimate how far price may pull back, which helps with entries. Extensions estimate how far it may travel beyond the prior swing, which helps with targets. Common extension levels are 127.2%, 161.8% and 261.8%.