


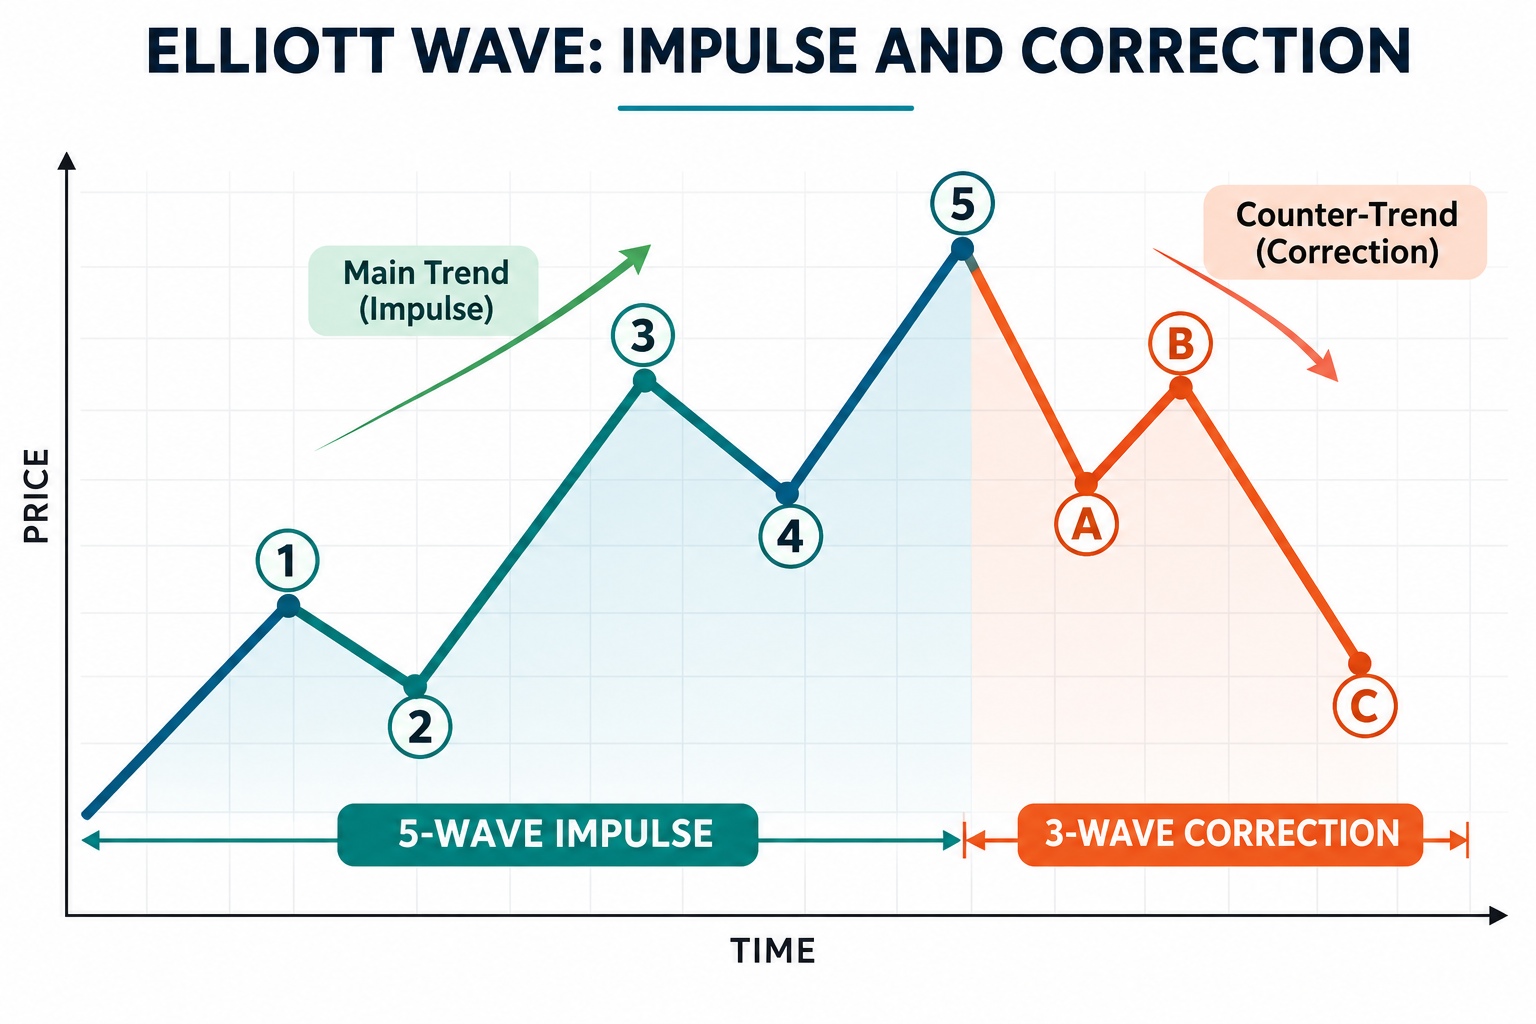
Elliott Wave Theory is a price analysis method that uses price wave movements to interpret market sentiment, crowd psychology, and evolving market expectations. Market participants can use this theory to identify potential trend direction, anticipate correction points, and plan their analysis accordingly. The Elliot Wave Theory works best in trending markets with well-defined directional progress and retracement periods. does not work in ranging markets.
1. What Is Elliott Wave Theory and How Did It Start?
Ralph Nelson Elliott was an American accountant who noticed that market prices followed recurring patterns that reflected investor behavior. He described his observations in a 1938 publication titled The Wave Principle. The summary of his findings was that wave patterns were repetitive structures that occurred across various market cycles and timeframes. He called them Elliot waves.
2. The Basics of Elliott Wave Theory: Impulse Waves and Corrective Waves
Elliott’s theory, now known as Elliott Wave Theory, indicates that there is a major market move followed by a smaller corrective move. The major market move, called an impulse wave, consists of waves that generally move in the direction of the major trend, while the smaller corrective wave is made up of three counter-trend waves that move in a direction contrary to that of the major wave. Elliot indicated that the major wave was the primary trend, while the corrective represented retracements or profit-taking counter-trend moves.
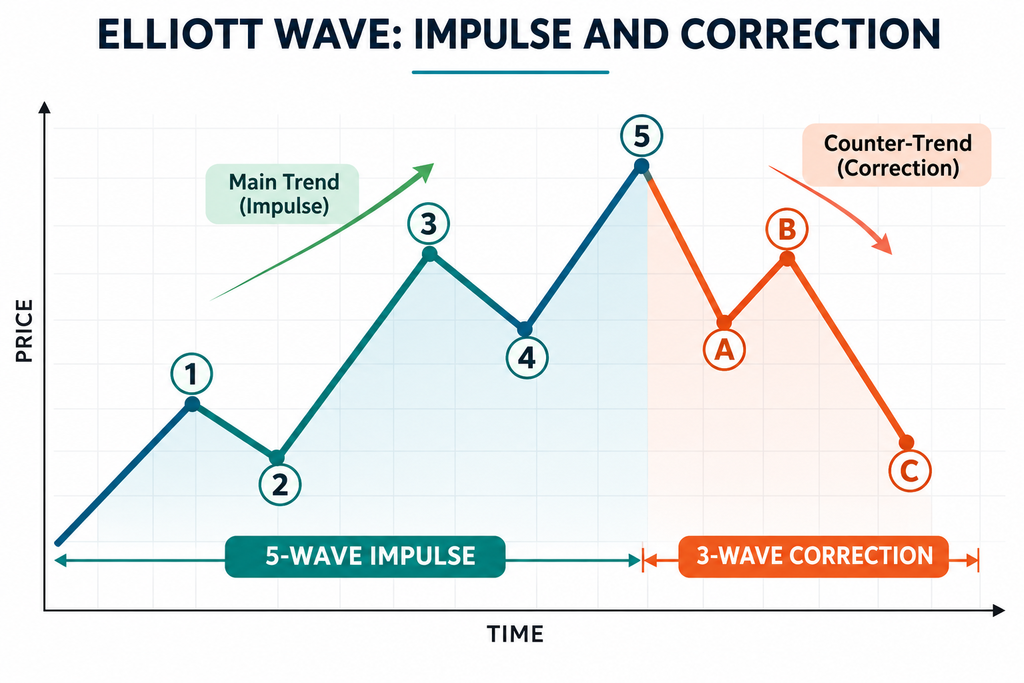
In this manner, the impulse waves were labeled 1, 2, 3, 4, and 5, where waves 1, 3, and 5 move in the direction of the major trend, while waves 2 and 4 represent temporary retracements or pullbacks. The corrective wave sequence is an a-b-c wave, where waves a and c move in the direction of the countertrend pullback and represent a partial recovery.
This wave sequence occurs in both bullish and bearish markets: the five-wave impulse moves upward in a bullish market and downward in a bearish market.
3. The 3 Core Rules of Elliott Wave Theory
Under Elliott Wave Theory, wave-pattern analysis must follow three rules for the wave patterns to be considered valid. These rules help traders distinguish valid impulse waves from invalid ones. The rules are as follows:
- Wave 2 cannot retrace beyond 100% of Wave 1’s move. In other words, the Wave 2 retracement must end within the length of Wave 1’s move.
- Wave 3 can never be the smallest or shortest of the 1, 3, 5 wave components of the impulse wave. Wave 3 is the strongest and most extended of the three waves, even though it is not the longest.
- Wave 4 cannot overlap within Wave 1’s price territory. In the standard impulsive move, Wave 4 must be outside of Wave 1’s price range.
4. Common Elliott Wave Patterns: Impulse, Zigzag, Flat, and Triangle
Elliott Wave Theory recognizes that price moves don’t occur in a straight line; they form peaks and troughs that create recurring structures corresponding to continuation and corrections. Charles Dow identified market price movements and classified them into ripples (minor trend), waves (secondary trend), and tides (primary trend). Since we are dealing with waves in the Elliot Wave Theory, we recognize impulse, zigzag, flat, and triangle formations within the waves as ripples.
Within the 1-2-3-4-5-a-b-c Elliot Wave setting, we have the impulse waves, zigzags, flats, and triangles.
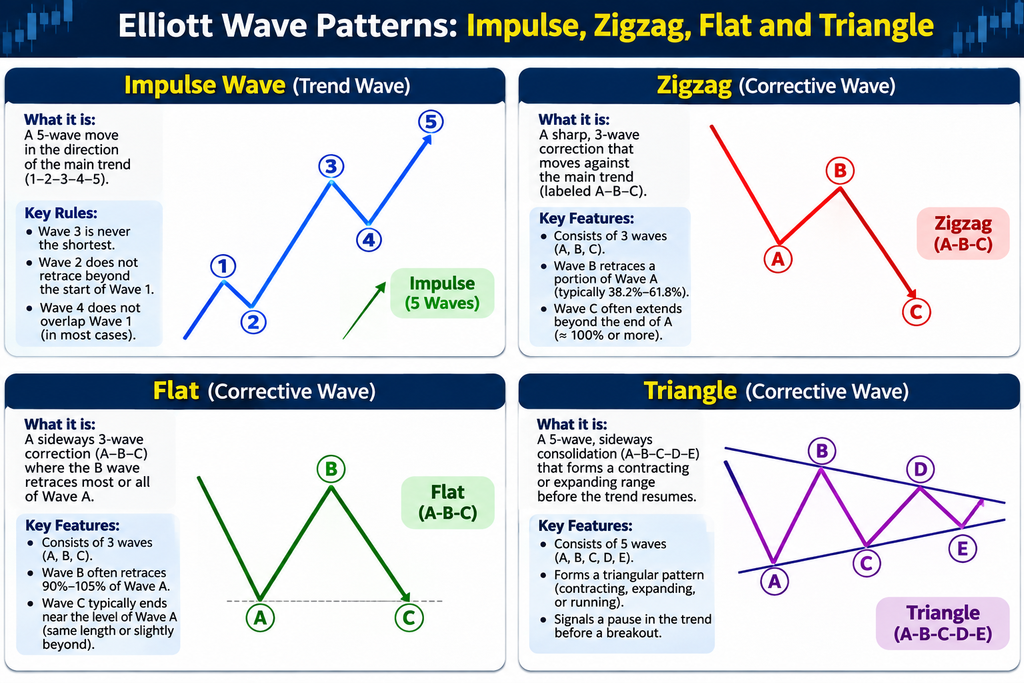
- Impulse: This is the 5-wave 1–2–3–4–5 Elliot Wave format that heads in the major trend’s direction.
- Zigzag: This is the a-b-c corrective wave sequence, so named because its movement is like a zigzag. Wave b retraces into part of Wave a, with termination point determined by the Fibonacci retracement tool.
- Flat: A consolidative corrective pattern where the a-b corrective waves are of similar length. Wave c completes the corrective cycle.
- Triangle: A corrective pattern with 5 waves labelled A–B–C–D–E. Triangles may converge (symmetrical) or diverge (megaphone pattern, expanding triangle).

5. How to Trade With Elliott Wave Theory: Entries, Stop Loss, and Targets
Elliott Wave analysis helps identify potential entry points once a corrective wave has ended. It also serves for entries as an impulse wave develops. More commonly, traders wait for the end of Wave 2’s correction, then get into the market in anticipation of a stronger Wave 3 advance. Price action confirmation parameters are used to filter entries.
Here is a framework for a trade using Elliot Wave analysis:
- Entry: Waves 2 and 4 are corrective waves. Look for the end of these waves, and trade their reversal (i.e., the start of the new impulse wave within the prevailing trend). This means that your trades should be at the start of Wave 3 and Wave 5. Wave 3 is the best entry wave. Use confirmations from patterns, candlesticks, or a momentum/volume indicators.
- Stop loss: Place the stop just beyond the price level where the corrective wave count invalidates the start point of the previous impulse wave.
- Profit targets: Use Fibonacci extension levels to get the estimated end points of the wave move, while respecting support and resistance levels.
- Risk management: Use an appropriate position size that corresponds to 0.5%-1% of your account size, while also factoring in the stop-loss distance.
6. Elliott Wave and Fibonacci: How They Work Together
Fibonacci ratios, especially retracement points, usually complement Elliott Wave analysis. The retracement levels point to where corrective waves may end and where impulse waves may reach before a new round of correction occurs. Estimates of potential correction depths and impulse wave extensions follow the common retracement and extension levels of Fibonacci tools. Levels such as the 50%, 61.8%, 70.50% and 78.6% are potential levels used to gauge corrective depths, while extensions such as the 27%, 61.8%, 100.0%, 127.2% and 161.8% are used to determine impulse extensions and hence profit targets for trades that follow the impulse waves.
| Wave structure | Fibonacci reference (swing high to low in downtrend, swing low to high in uptrend) |
|---|---|
| Wave 2 | 50%–61.8% retracement of Wave 1 |
| Wave 3 | 161.8% extension of Wave 1 |
| Wave 4 | 23.6%–38.2% retracement of Wave 3 |
| Wave 5 | 61.8%–100% projection of the earlier impulse, depending on market structure |
These are general guidelines and are not hard and fast rules about the extent of the depths or extensions of the various impulse waves.
7. Frequently Asked Questions About Elliott Wave Theory
Is Elliott Wave Theory accurate?
Elliott Wave Theory is only as accurate as the skill of the trader using it. The wave count is subjective, and two traders can interpret the same chart scenarios very differently.
How many waves are in an Elliott Wave cycle?
An Elliott Wave cycle is made up of 8 waves: five impulse waves labeled 1–5, followed by three corrective waves labeled a–b–c. The wave count is only as good as the time frame in which it is detected, as these waves may be smaller components of larger sequences on higher time-frame charts.
What is the difference between an impulse wave and a corrective wave?
An impulse wave heads in the direction of the primary trend and houses waves 1, 2, 3, 4, and 5. A corrective wave retraces against the trend and contains three subwaves (a, b, and c). Impulses represent trend progression, while corrections represent profit-taking retracements.
Can beginners use Elliott Wave Theory?
Elliot Wave analysis is best used by traders who already know how to apply Fibonacci tools, support and resistance lines, and risk management. It may not suit beginners.
What is the best timeframe for Elliott Wave analysis?
Elliott Wave Theory can be used on any timeframe. It works best on H4 and daily charts because they have less market noise.