


- Fibonacci sequence percentages, especially the 61.8% Golden Ratio, help traders spot potential support and resistance during market pullbacks.
- Traders draw these lines between a swing low and a swing high in uptrends or the opposite in downtrends to find promising entry points during pullbacks
- You shouldn't trade these levels alone. Fibonacci retracements are strongest when confirmed by other signals, such as candlestick patterns, volume, or moving averages.
Fibonacci retracement is a popular tool in technical analysis. It helps traders spot where prices might find support or resistance during a pullback.
Traders apply this tool after a big price move. It helps them gauge how deep a market correction might get before the original trend picks up again.
The method uses ratios derived from the Fibonacci sequence. This mathematical series pops up throughout nature, and many in finance think it also influences price movements.
The Math Behind Fibonacci
The technique started with Leonardo Fibonacci, a 13th-century mathematician. He introduced this numerical sequence: 0, 1, 1, 2, 3, 5, 8, 13, 21, 34, 55, 89, 144, and so on.
Each number in this sequence is the sum of the two before it. Go further along the series, and if you divide any number by the next one, you’ll get roughly 0.618. This is what we call the Golden Ratio. For example, 55/89= approx. 0.618
- 23.6%: Suggests a shallow correction.
- 38.2%: Indicates a moderate pullback.
- 50.0%: Not a strict Fibonacci ratio, but this level frequently shows up when markets retrace about half of an earlier move. Trader psychology likely plays a role here.
- 61.8%: This is the primary Golden Ratio level. Many consider it a significant zone for support or resistance after a deep correction.
- 78.6%: Derived as the square root of 0.618, this level marks a deep pullback and serves as a final potential area before a trend might reverse.
Practical Example
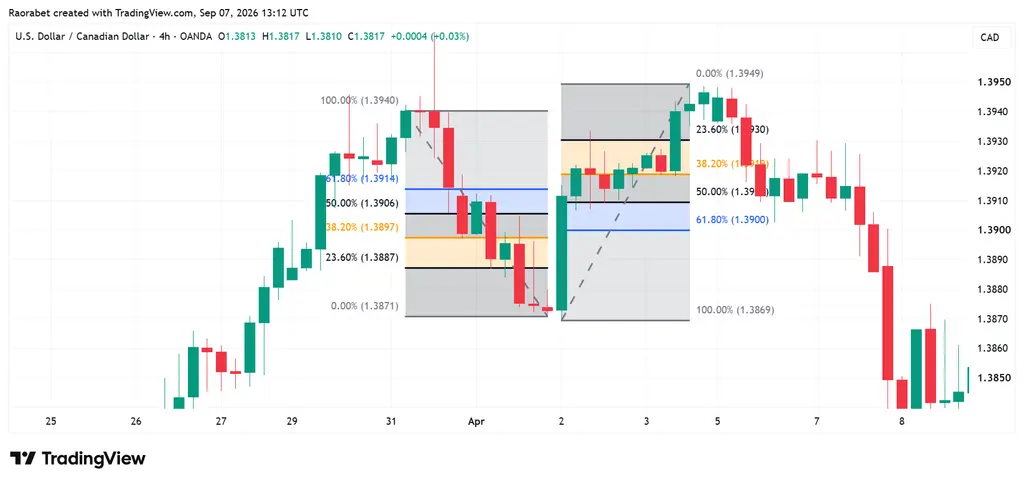
USD/CAD forex pair on a 4-hour chart. Created on TradingView
On the chart on the USD/CAD 4-hour timeframe above, one retracement spanned a swing high of 1.3871 to a swing low of 1.3940. The price then pulled back towards the 61.8% level at 1.3914. It paused in the 38.2%-61.8% zone, falling within the “golden pocket” (1.3897-1.3914), before approaching the initial low of 1.3871.
A second retracement followed, covering the range between 1.3869 and 1.3949. The price again pulled back, this time to the 61.8% level at 1.3900. After that, it moved above the 23.6% level at 1.3930. This suggested a potential move to higher levels. This price action shows the golden pocket area provided strong support for buying interest.
The second Fibonacci setup, the one that played out before the trend reversed, worked out like this:
Pip count:
Entry (bounce off 61.8% golden pocket): 1.3900
Exit (near the swing high before the reversal candle): about 1.3945
Pips gained: (1.3945 − 1.3900) ÷ 0.0001 = approximately 45 pips
How to Draw Fibonacci Retracement Levels
The reliability of Fibonacci retracement analysis depends on correctly identifying price extremes, referred to as swing points.
1. How to Draw in an Uptrend

- Identify the lowest price of a recent upward price movement (Swing Low)
- Next, find the highest price reached during that same advance ((Swing High).
- Select the Fibonacci Retracement tool on your platform. Start the drawing by clicking on the Swing Low, then drag the cursor to the Swing High.
You’ll see horizontal lines appear at various percentage levels below the Swing High. These levels might show where the price could find support during a pullback, possibly attracting buyers.
2. How to Draw in a Downtrend
- Locate the highest price of a recent downward price movement (Swing High)
- Identify the lowest price reached during that decline (Swing Low).
- Click on the Swing High and drag the cursor down to the Swing Low.
The tool then draws horizontal lines above the Swing Low. These lines can act as resistance zones during price corrections, hinting at places sellers might step in.
Most modern charting software has a built-in Fibonacci retracement tool. Once you pick it, you usually click the starting swing point and drag to the ending one. The software automatically calculates and displays the retracement levels.
Fibonacci levels can be more significant when they align with other technical indicators like previous support or resistance levels, moving averages, or trend lines.
Tips for Effective Application
To use it well, first look at longer time frames to spot the main price swing. Then, move to shorter time frames to identify precise entry points. Keep your charts clean and don’t show too many Fibonacci grids at once.
Always combine Fibonacci retracements with smart risk management. For instance, place stop-loss orders below the next Fibonacci level or a recent price extreme. Also, adjust your position sizes so any potential loss stays within what you’re comfortable losing.
Remember, Fibonacci retracement shows probabilities, not certainties. It points to areas where price will likely react, but market forces can sometimes override these technical levels.
When you use Fibonacci retracement consistently and with other confirmations, it helps you anticipate turning points during price corrections and when trends resume. It links mathematical principles to real market activity and remains a valuable tool for traders at any level.
Always wait for confirmation before placing a limit buy order at a specific price. Look for price action signals, maybe a hammer candlestick formation or a big jump in buying volume, to confirm that level is holding as support.
Fibonacci levels work best in strongly trending markets. But in volatile, ranging conditions, price might just blow past them without a reaction.
Using Other Tools and Mistakes to Avoid When Using Fibonacci Retracement
Fibonacci retracement levels are more reliable when they align with other technical indicators. Think about prior support or resistance areas, moving averages, or trend lines.
When these indicators align, it often points to a stronger likelihood of a significant price move. Traders also use Fibonacci extensions, like 127.2% or 161.8%, to find potential profit targets if a trend keeps going.
Common mistakes involve traders often misusing this tool. They might apply it to minor price fluctuations, in non-trending or sideways markets, or make trades only on a Fibonacci level without other confirmation. It’s most effective in clear trends, and it loses its power when markets just move sideways or within a range.
The 61.8% level, also known as the golden ratio, often marks important support or resistance during trend corrections.
To draw these, you anchor the tool at a significant swing low and extend it to a significant swing high. That’s how the levels can show potential support.
No, it works best when combined with other signals. Look at things like candlesticks, volume, or other technical indicators