Ethereum Price, Chart and Analysis

ETH Crypto Rank #2 10 articles
$1,927.65 -4.07% 24h
Market cap
$235.59B
24h volume
$14.75B
7d change
-13.66%
All-time high
$4,946.05

Ethereum (ETH) is trading at $1,927.65, -4.07% in the last 24 hours. Its market cap is $235.59B, ranked #2 among cryptocurrencies. About $14.75B changed hands in the last 24 hours. It trades 61.0% below its all-time high of $4,946.05 set on Aug 24, 2025. Prices as of Nov 14, 2026 01:41 UTC.

Ethereum live chart

InvestingCube chart · Binance data

Ethereum outlook at a glance

Daily biasBearishStrong sell on the daily chart
Weekly trendBearishStrong sell
4-hour signalBearishConfirms the daily bias
MomentumFadingMACD below its signal
VolatilityStableDaily range ≈ 4.81%

Ethereum has a bearish bias on the daily chart (strong sell), and the 4-hour chart agrees. The price sits between support at 1,876.85 and resistance at 1,925.62; a daily close outside that range decides the next move.

Scenario 1 of 3

Bullish continuation

A daily close above 1,925.62 would confirm buyers are in control and open the way to 1,948.98.

Invalidated below 1,876.85
Scenario 2 of 3

Range / neutral

Without a break, Ethereum is likely to trade between 1,876.85 and 1,925.62 while momentum resolves.

Ends on a daily close outside the range
Scenario 3 of 3Primary

Bearish reversal

A daily close below 1,876.85 would hand control to sellers, with 1,823.82 as the next level to watch.

Invalidated above 1,925.62

Price at last update 1,889.34 · Nov 14, 2026 02:28 UTC · scenarios follow the data and are not trade recommendations.

Ethereum technical analysis

Ethereum last traded at $1,889.34, -5.64% on the day (as of Nov 14, 2026 02:28 UTC).

On the daily chart our technical summary reads strong sell: 2 of 26 indicators point higher, 17 point lower and 7 are neutral. Moving averages signal strong sell, while oscillators signal sell.

The price is below its 50-day moving average (2,400.73) and below its 200-day moving average (2,146.96), and the 50-day sits above the 200-day, the structure of a longer-term uptrend. The 14-day RSI stands at 24.1, in oversold territory, and MACD is below its signal line.

Based on daily pivot points, the nearest support sits at 1,876.85 and 1,823.82, with resistance at 1,948.98 and 2,002.01.

Ethereum lost 21.19% over the past month, is down 35.23% year to date, and trades 45.2% below its 52-week high of 3,447.44.

On the weekly chart the summary is strong sell, and on the 4-hour chart it is sell.

Indicators at a glance

RSI (14)

Daily 24.1 Oversold
4-hour 28.5 Oversold
03070100

MACD (12, 26, 9)

Below signalHistogram negative and widening

Bollinger Bands (20, 2)

0% of the band
Pressing the lower band

Moving averages

Below both50-day 2,400.73 · 200-day 2,146.96

ATR (14)

92.59Stable · 4.81% of price per day

Technical summary by timeframe

Ethereum technical summary on the 1 day timeframe: Strong sell. 2 indicators signal buy, 17 sell and 7 neutral.

Oscillators
Sell
Sell
3
Neutral
7
Buy
1
Summary
Strong sell
Sell
17
Neutral
7
Buy
2
Moving averages
Strong sell
Sell
14
Neutral
0
Buy
1
Oscillators
NameValueAction
Relative Strength Index (14)24.06Neutral
Stochastic %K (14, 3, 3)6.33Neutral
Commodity Channel Index (20)-164.22Buy
Average Directional Index (14)29.77Sell
Awesome Oscillator-281.09Neutral
Momentum (10)-500.13Sell
MACD Level (12, 26)-116.94Sell
Stochastic RSI Fast (3, 3, 14, 14)0.0000Neutral
Williams Percent Range (14)-94.85Neutral
Bull Bear Power-356.78Neutral
Ultimate Oscillator (7, 14, 28)40.96Neutral
Moving averages
NameValueAction
Exponential Moving Average (10)2,073.74Sell
Simple Moving Average (10)2,096.33Sell
Exponential Moving Average (20)2,172.54Sell
Simple Moving Average (20)2,199.01Sell
Exponential Moving Average (30)2,237.57Sell
Simple Moving Average (30)2,267.11Sell
Exponential Moving Average (50)2,302.93Sell
Simple Moving Average (50)2,400.73Sell
Exponential Moving Average (100)2,304.95Sell
Simple Moving Average (100)2,379.15Sell
Exponential Moving Average (200)2,311.80Sell
Simple Moving Average (200)2,146.96Sell
Ichimoku Base Line (9, 26, 52, 26)2,211.29Sell
Volume Weighted Moving Average (20)2,208.71Sell
Hull Moving Average (9)1,918.44Buy
Pivot points (1 day)
LevelClassicFibonacciCamarilla
R32,127.172,074.141,964.30
R22,074.142,026.331,952.83
R12,002.011,996.791,941.35
P1,948.981,948.981,948.98
S11,876.851,901.171,918.41
S21,823.821,871.631,906.93
S31,751.691,823.821,895.46

Calculated by InvestingCube from Binance price data · Updated Nov 14, 2026 02:28 UTC · Indicator signals are mechanical and are not investment advice.

Ethereum support and resistance levels

LevelRoleWhy it mattersDistance
2,074.14ResistanceDaily pivot R2Classic pivot from the previous session’s range+7.78%
2,002.01ResistanceDaily pivot R1Classic pivot from the previous session’s range+4.03%
1,948.98ResistanceDaily pivot PBalance point of the previous session+1.27%
1,925.62ResistanceLower Bollinger Band (20, 2)Price stretched to the downside+0.06%
Price now 1,889.34
1,876.85SupportDaily pivot S1Classic pivot from the previous session’s range-2.47%
1,823.82SupportDaily pivot S2Classic pivot from the previous session’s range-5.23%
1,751.69SupportDaily pivot S3Classic pivot from the previous session’s range-8.98%
1,505.68Support52-week lowThe one-year floor-21.76%

Ethereum Price Forecast: Technical Assessment And Performance Outlook

This analysis was last updated on April 16, 2025. Prices and levels mentioned below are from that date; see the live price and chart above for where Ethereum trades now.

Summary:
  • Ethereum price has had a rough start to the year and is nearly 50% down. We discuss this coin's origins, its performance and prospects.

Price Prediction

Ethereum price return to the $1,500 support has helped it build traction that could help propel it retest the $2k psychological level. The coin gained 7.22% in the last week, which has helped it build positive sentiment. However, it is down by 49% year-to-date and its DeFi TVL dropped by 0.28% in the last 24 hours.

In addition, it has registered net negative outflows in the ETH spot ETF market for the last six successive sessions, signaling declining institutional confidence in its upside potential. Its latest trading session saw it record $14.2 million worth of outflows, up from $6 million previously.

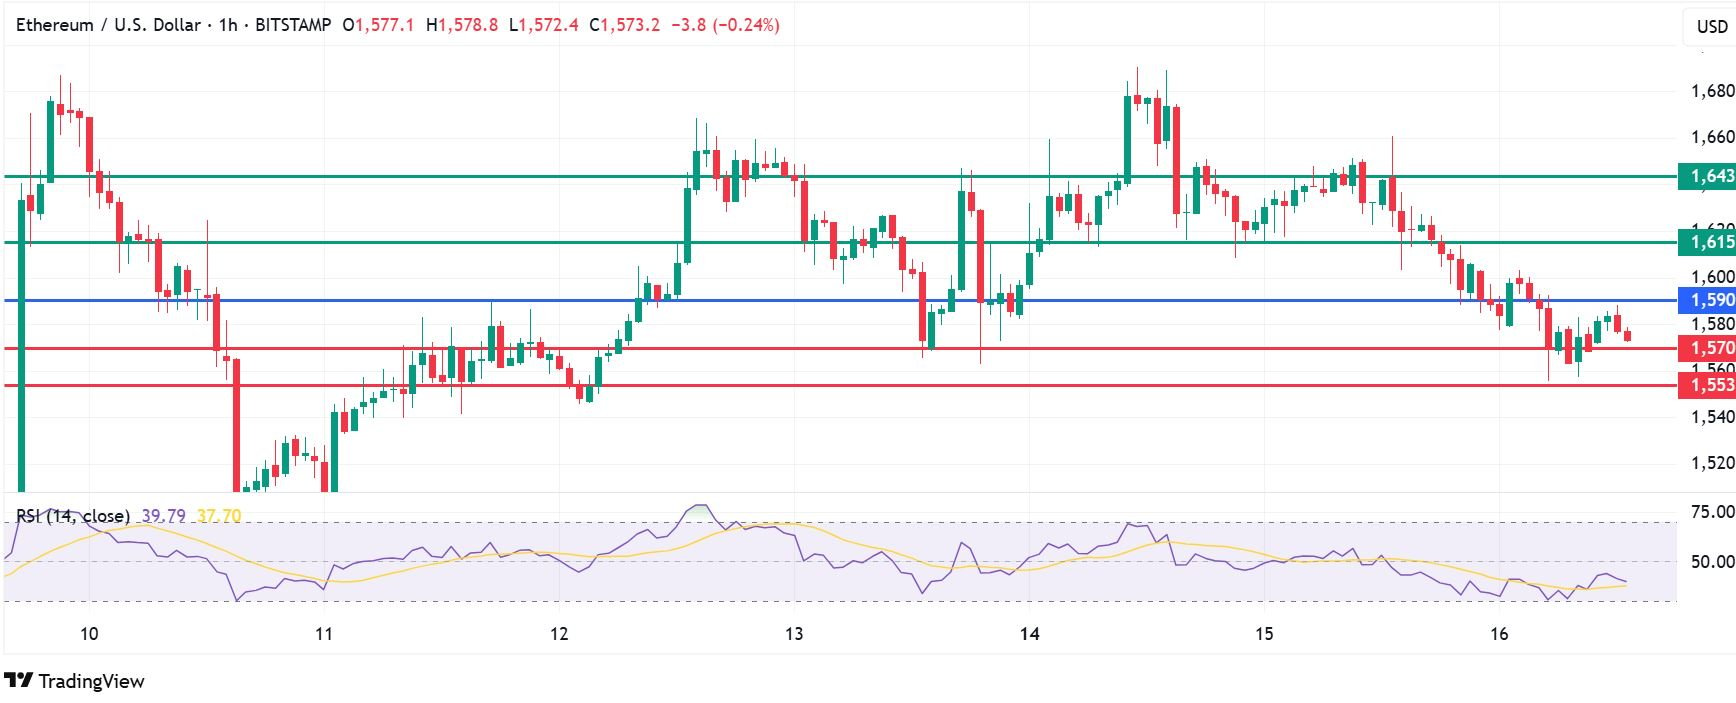
ETH price is currently at $1,576, below the Volume Weighted Moving Average (VWMA) level of $1,672 on the daily chart. In addition its RSI reading is at 39, adding credence to the likelihood of bearish control in the near-term.

Technical Analysis

The momentum on Ethereum price favours the sellers to stay in control below the pivot mark at $1,590. Primary support will likely be at $1,565, but a stronger momentum will break below that mark and send the price lower to test $1,550.

On the upside, moving above $1,590 will shift the momentum towards bullish control. That will likely see the gains encounter the first resistance at $1,610. Breaking above that level will invalidate the downside narrative. Also, it could result in extended gains to test $1,620.

What is Ethereum?

Ethereum (or Ether) is a decentralised layer 1 blockchain with smart contract functionality. Its ecosystem supports building and deployment of decentralised applications (dApps) as well as Decentralised Finance (DeFi).

Its native coin is Ether, or ETH and it is the one that powers the ecosystem and used to pay for transaction. The Ethereum blockchain ecosystem is compatible with not only ETH, but also ERC-20 tokens minted on that blockchain
Conclusion

Ethereum price has recently built traction by reclaiming the $1,500 support. However, it trades below its VWMA on the daily chart and a weak RSI adds to the prospect of continued decline in the near-term. Conversely, reclaiming the VWMA as its support and moving its RSI to levels above 50 will be among the most important steps in initiating a reversal. That could also help improve investor sentiment and see it register gains in the ETF market.


Latest Ethereum news and analysis

Ethereum performance and statistics

1 week-14.09%
1 month-21.19%
3 months+2.23%
6 months-11.75%
Year to date-35.23%
1 year-38.16%
52-week low 1,505.6852-week high 3,447.44
Previous close2,002.30
Open1,929.88
Day range1,889.34 – 1,936.49
Volume20.51M
Average volume (20 days)511.51M
Average daily range (ATR 14)5.15%

Ethereum historical data

Ethereum yearly history
YearAverage closeOpenHighLowCloseChange
2026 YTD2,141.842,971.653,402.891,505.681,929.86-35.06%
20253,017.873,337.784,956.781,385.052,971.64-10.97%
20243,115.922,281.874,107.802,100.003,337.78+46.27%
20231,834.241,196.132,445.801,190.572,281.87+90.77%
20221,937.773,676.223,900.73881.561,196.13-67.46%
20212,829.99736.424,868.00714.293,676.23+399.20%
2020339.39129.16758.7486.00736.42+470.16%
2019178.26131.45366.80100.91129.16-1.74%
2018455.45733.011,440.0081.79131.45-82.09%
2017431.09301.13864.90144.21733.98—
Last 12 months
MonthOpenHighLowCloseChange
Nov 20262,255.652,450.001,895.951,929.86-14.44%
Oct 20262,686.012,777.332,174.082,255.66-16.02%
Sep 20262,467.642,807.342,356.412,686.01+8.85%
Aug 20261,862.602,566.531,822.062,467.65+32.48%
Jul 20261,572.001,981.241,552.921,862.60+18.49%
Jun 20262,007.022,021.501,505.681,572.01-21.67%
May 20262,257.512,423.741,967.002,007.01-11.10%
Apr 20262,105.432,464.912,017.042,257.51+7.22%
Mar 20261,964.512,386.021,907.412,105.43+7.17%
Feb 20262,451.962,475.981,747.801,964.51-19.88%
Jan 20262,971.653,402.892,250.002,451.95-17.49%
Dec 20252,991.253,447.442,716.042,971.64-0.66%

Ethereum seasonals

JanMaySep+75.5%+9.5%-56.5%
  • 2026 -38.59%
  • 2025 -13.51%
  • 2024 +59.34%

Average return by month

Jan+15.43%up 56% of 9 yrs
Feb+4.00%up 67% of 9 yrs
Mar-3.27%up 67% of 9 yrs
Apr+17.62%up 67% of 9 yrs
May+9.75%up 56% of 9 yrs
Jun-11.58%up 22% of 9 yrs
Jul+16.50%up 56% of 9 yrs
Aug+1.63%up 44% of 9 yrs
Sep-6.85%up 40% of 10 yrs
Oct+3.71%up 60% of 10 yrs
Nov+7.58%up 56% of 9 yrs
Dec+7.17%up 44% of 9 yrs

Since 2017, Ethereum has done best in April (average +17.62%) and worst in June (average -11.58%). Past seasonal patterns don’t guarantee future returns.

About Ethereum

Ethereum is a decentralized operating system. The platform introduced, in practice, the concept of "decentralized applications". Its founder, Vitalik Buterin, has been engaged in the development of blockchain and Bitcoin since its inception.

Today, several cryptocurrencies are issued in ICOs using Ethereum. These tokens are called ERC-20, and they are the foundation for running scripts in the Ethereum Virtual Machine. Through the development of "smart contracts", Ethereum made it possible to sign tokens that have a specific function besides being a medium of exchange and broadened the capabilities of blockchain "transactions".

Its key cryptocurrency is the Ether, which is usually used for payments in smart contracts or dApps. In addition, Ethereum is also fueled with GAS, a cryptocurrency associated with operations that require some kind of computation from its nodes. The GAS price is proportional to the type of the computational power required execute a task. Therefore, a fee in GAS is included to pay for the nodes running or authenticating a transaction.

Originally, Ethereum used proof-of-work to reach consensus. The Casper protocol, however, gradually shifted Ethereum consensus from PoW to a custom proof-of-stake protocol.

Ethereum FAQ

Is Ethereum bullish or bearish right now?

On the daily chart our technical summary for Ethereum is strong sell, with 2 of 26 indicators signalling buy and 17 signalling sell. The weekly summary is strong sell.

What are the key Ethereum support and resistance levels?

The nearest resistance is 1,925.62 (lower bollinger band (20, 2)) and the nearest support is 1,876.85 (daily pivot s1).

What would change the Ethereum outlook?

A daily close above 1,925.62 would strengthen the bullish case, while a daily close below 1,876.85 would favour sellers.

How has Ethereum performed this year?

Ethereum is down 35.23% year to date and down 38.16% over the past 12 months. Its 52-week range is 1,505.68 to 3,447.44.

What is the highest price Ethereum has reached?

In the monthly data we track since 2017, the highest price is 4,956.78; Ethereum now trades 61.9% below it.

Methodology, data and sources

Price data
Binance (open, high, low, close, volume)
Last update
Nov 14, 2026 02:28 UTC · refreshed hourly
Candles
1-hour, 4-hour, daily, weekly and monthly; times in UTC
Indicators
RSI(14), Stochastic(14,3,3), CCI(20), ADX(14), Awesome Oscillator, Momentum(10), MACD(12,26,9), Stochastic RSI(3,3,14,14), Williams %R(14), Bull Bear Power, Ultimate Oscillator(7,14,28); EMA/SMA 10–200, Ichimoku(9,26,52), VWMA(20), Hull MA(9); Bollinger(20,2), ATR(14)
Ratings
Each indicator votes buy, neutral or sell; oscillators and moving averages are averaged separately, and the summary is the mean of both.
Levels
Classic, Fibonacci and Camarilla pivots from the previous session, Bollinger Bands, 50- and 200-day averages and the 52-week range.

These sections are calculated automatically by InvestingCube and update with the market. They describe what the data shows and are not investment advice. Editorial analysis on this page is written by our team.

Charts and market data by TradingView. Coin figures by CoinGecko, refreshed hourly. Prices may be delayed. This page is for information only and is not investment advice.

  • S&P 5007,561.67▼ -0.40%
  • Nasdaq 10027,943.74▼ -1.22%
  • Dow Jones52,347.55▲ +0.10%
  • DAX26,749.95▼ -0.08%
  • FTSE 10010,902.56▲ +0.36%
  • Nikkei 22561,142.35▲ +0.53%
  • Nifty 5025,144.30▼ -0.61%
  • Gold3,887.60▲ +0.06%
  • WTI oil88.92▲ +0.20%
  • Brent oil96.08▲ +0.27%
  • Silver48.65▼ -2.83%
  • EUR/USD1.1028▼ -0.29%
  • GBP/USD1.3209▼ -0.19%
  • USD/JPY159.69▼ -0.10%
  • USD/INR94.23▲ +0.20%
  • Dollar index103.41▲ +0.23%
  • Bitcoin67,666.66▼ -4.13%
  • Ethereum1,906.47▼ -4.72%
  • Solana75.93▼ -6.00%
  • XRP0.99360▼ -3.16%
  • Nvidia162.85▼ -2.01%
  • Apple356.27▲ +0.39%
  • Microsoft523.88▲ +0.17%
  • Amazon266.66▼ -0.29%
  • Alphabet295.77▼ -0.98%
  • Meta641.69▲ +2.90%
  • Tesla390.22▼ -1.82%