Cardano (ADA) Price, Chart and Analysis

ADA Crypto Rank #18 10 articles
$0.1828 -1.92% 24h
Market cap
$6.87B
24h volume
$152.83M
7d change
-5.20%
All-time high
$3.09

Cardano (ADA) is trading at $0.1828, -1.92% in the last 24 hours. Its market cap is $6.87B, ranked #18 among cryptocurrencies. About $152.83M changed hands in the last 24 hours. It trades 94.1% below its all-time high of $3.09 set on Sep 1, 2021. Prices as of Nov 7, 2026 13:38 UTC.

Cardano live chart

InvestingCube chart · Binance data

Cardano outlook at a glance

Daily biasBearishStrong sell on the daily chart
Weekly trendBearishSell
4-hour signalBearishConfirms the daily bias
MomentumFadingMACD below its signal
VolatilityContractingDaily range ≈ 6.47%

Cardano has a bearish bias on the daily chart (strong sell), and the 4-hour chart agrees. The price sits between support at 0.18003 and resistance at 0.18487; a daily close outside that range decides the next move.

Scenario 1 of 3

Bullish continuation

A daily close above 0.18487 would confirm buyers are in control and open the way to 0.18893.

Invalidated below 0.18003
Scenario 2 of 3

Range / neutral

Without a break, Cardano is likely to trade between 0.18003 and 0.18487 while momentum resolves.

Ends on a daily close outside the range
Scenario 3 of 3Primary

Bearish reversal

A daily close below 0.18003 would hand control to sellers, with 0.17597 as the next level to watch.

Invalidated above 0.18487

Price at last update 0.18290 · Nov 7, 2026 13:38 UTC · scenarios follow the data and are not trade recommendations.

Cardano technical analysis

Cardano last traded at $0.18290, -1.98% on the day (as of Nov 7, 2026 13:38 UTC).

On the daily chart our technical summary reads strong sell: 1 of 26 indicators point higher, 18 point lower and 7 are neutral. Moving averages signal strong sell, while oscillators signal sell.

The price is below its 50-day moving average (0.22649) and below its 200-day moving average (0.20740), and the 50-day sits above the 200-day, the structure of a longer-term uptrend. The 14-day RSI stands at 33.4, below the 50 midline, a sign of soft momentum, and MACD is below its signal line.

Based on daily pivot points, the nearest support sits at 0.18003 and 0.17597, with resistance at 0.18487 and 0.18893.

Cardano lost 21.23% over the past month, is down 45.16% year to date, and trades 69.9% below its 52-week high of 0.60690.

On the weekly chart the summary is sell, and on the 4-hour chart it is strong sell.

Indicators at a glance

RSI (14)

Daily 33.4 Neutral
4-hour 40.4 Neutral
03070100

MACD (12, 26, 9)

Below signalHistogram negative and narrowing

Bollinger Bands (20, 2)

15% of the band
Pressing the lower band

Moving averages

Below both50-day 0.22649 · 200-day 0.20740

ATR (14)

0.01181Contracting · 6.47% of price per day

Technical summary by timeframe

Cardano technical summary on the 1 day timeframe: Strong sell. 1 indicators signal buy, 18 sell and 7 neutral.

Oscillators
Sell
Sell
3
Neutral
7
Buy
1
Summary
Strong sell
Sell
18
Neutral
7
Buy
1
Moving averages
Strong sell
Sell
15
Neutral
0
Buy
0
Oscillators
NameValueAction
Relative Strength Index (14)33.41Neutral
Stochastic %K (14, 3, 3)13.66Neutral
Commodity Channel Index (20)-106.29Buy
Average Directional Index (14)32.16Sell
Awesome Oscillator-0.0300Neutral
Momentum (10)-0.0236Sell
MACD Level (12, 26)-0.0117Sell
Stochastic RSI Fast (3, 3, 14, 14)35.85Neutral
Williams Percent Range (14)-85.19Neutral
Bull Bear Power-0.0195Neutral
Ultimate Oscillator (7, 14, 28)44.08Neutral
Moving averages
NameValueAction
Exponential Moving Average (10)0.19075Sell
Simple Moving Average (10)0.18950Sell
Exponential Moving Average (20)0.20005Sell
Simple Moving Average (20)0.20083Sell
Exponential Moving Average (30)0.20660Sell
Simple Moving Average (30)0.21191Sell
Exponential Moving Average (50)0.21209Sell
Simple Moving Average (50)0.22649Sell
Exponential Moving Average (100)0.21314Sell
Simple Moving Average (100)0.21348Sell
Exponential Moving Average (200)0.23632Sell
Simple Moving Average (200)0.20740Sell
Ichimoku Base Line (9, 26, 52, 26)0.20910Sell
Volume Weighted Moving Average (20)0.20087Sell
Hull Moving Average (9)0.18278Sell
Pivot points (1 day)
LevelClassicFibonacciCamarilla
R30.197830.193770.18655
R20.193770.190370.18573
R10.188930.188270.18492
P0.184870.184870.18487
S10.180030.181470.18328
S20.175970.179370.18247
S30.171130.175970.18165

Calculated by InvestingCube from Binance price data · Updated Nov 7, 2026 13:38 UTC · Indicator signals are mechanical and are not investment advice.

Cardano support and resistance levels

LevelRoleWhy it mattersDistance
0.19783ResistanceDaily pivot R3Classic pivot from the previous session’s range+8.40%
0.19377ResistanceDaily pivot R2Classic pivot from the previous session’s range+6.17%
0.18893ResistanceDaily pivot R1Classic pivot from the previous session’s range+3.53%
0.18487ResistanceDaily pivot PBalance point of the previous session+1.30%
Price now 0.18290
0.18003SupportDaily pivot S1Classic pivot from the previous session’s range-1.35%
0.17597SupportDaily pivot S2Classic pivot from the previous session’s range-3.58%
0.17486SupportLower Bollinger Band (20, 2)Price stretched to the downside-4.18%
0.17113SupportDaily pivot S3Classic pivot from the previous session’s range-6.23%

Cardano Price Breaches Key Barrier. What Are the Odds of $1?

This analysis was last updated on March 25, 2025. Prices and levels mentioned below are from that date; see the live price and chart above for where Cardano trades now.

Summary:
  • Cardano price has for the last week struggled to find stability above $0.750 but a third successive daily gain has done it. Could it hit $1?

Price Prediction

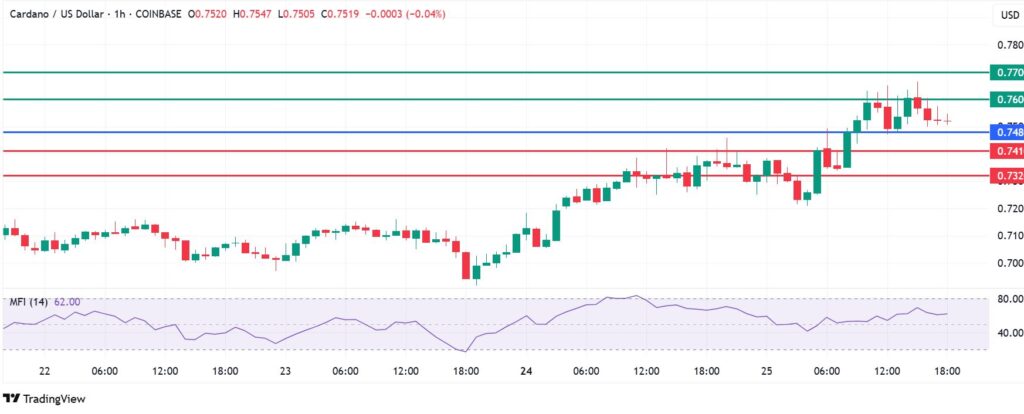
Cardano price has been trading sideways for the most part in the last week and a break above the $0.750 barrier could trigger a stronger upward momentum. The coin is on a three-day winning streak and has gone above the Volume Weighted Moving Average (VWMA) on the daily chart. In addition, the Money Flow Index (MFI) reading is at 57 on the daily timeframe, adding credence to the upward sentiment.

If it holds the $0.750 support, ADA price could build the momentum to reclaim the $0.800 mark in the near-term. Conversely, a slide back below that level could see it return to the previous $0.697-$0.746 range.

Technical Analysis

The momentum on Cardano price favours the buyers to be in control above $0.745 pivot level. That will likely result in the first resistance being established at $0.790. Clearing that barrier will signal a strong bullish hold, which could potentially take the action higher to test $0.800.

Alternatively, going below $0.745 will signal a return to the downward momentum. In that case, Cardano price will likely find its first support at $0.742. The upside narrative will be invalid if the price breaks below that level. Furthermore, the resulting momentum could send the coin lower to test $0.740.
In Summary

The momentum on Cardano price signals a likely continuation of the upside. It has an underlying positive sentiment, following its inclusion in the proposed strategic Federal cryptocurrency reserve.

In addition, President Donald Trump’s son, Donald Trump Jr is scheduled to speak at the DC BlockChain Summit to be hosted by Cardano Founder, Charles Hoskinson. This set up could provide support for ADA price gains in the coming days. The coin has the potential to reclaim the psychological $1 mark, but will likely face resistance at $0.800 and $0.900.

Latest Cardano news and analysis

Cardano performance and statistics

1 week-5.23%
1 month-21.23%
3 months-8.32%
6 months-32.46%
Year to date-45.16%
1 year-68.26%
52-week low 0.1382052-week high 0.60690
Previous close0.18660
Open0.18410
Day range0.18220 – 0.18570
Volume3.07M
Average volume (20 days)15.26M
Average daily range (ATR 14)5.60%

Cardano historical data

Cardano yearly history
YearAverage closeOpenHighLowCloseChange
2026 YTD0.221050.333600.437400.138200.18320-45.07%
20250.657640.845001.174700.273700.33350-60.54%
20240.537950.593901.326400.275600.84510+42.27%
20230.356420.245800.680000.220000.59400+141.66%
20220.613611.308001.638000.239200.24580-81.21%
20211.529320.181343.101000.167931.30800+621.30%
20200.095410.032850.197250.017650.18134+452.02%
20190.054220.040570.106870.030320.03285-18.97%
20180.131260.255510.388500.027080.04054—
Last 12 months
MonthOpenHighLowCloseChange
Nov 20260.192900.201500.177700.18320-5.08%
Oct 20260.246500.282400.182000.19300-21.74%
Sep 20260.197800.265400.190300.24660+24.67%
Aug 20260.168300.258400.168200.19780+17.60%
Jul 20260.144400.200000.142000.16820+16.48%
Jun 20260.235700.237600.138200.14440-38.74%
May 20260.246300.288700.228000.23570-4.30%
Apr 20260.241800.268000.234800.24630+1.86%
Mar 20260.281000.295500.232800.24180-13.95%
Feb 20260.293700.313600.220500.28100-4.29%
Jan 20260.333600.437400.268500.29360-11.96%
Dec 20250.414200.484200.329400.33350-19.50%

Cardano seasonals

JanMaySep+100.9%+17.3%-66.4%
  • 2026 -54.33%
  • 2025 -63.28%
  • 2024 +83.69%

Average return by month

Jan+21.37%up 50% of 8 yrs
Feb+32.02%up 38% of 8 yrs
Mar+5.06%up 50% of 8 yrs
Apr+1.00%up 63% of 8 yrs
May+5.74%up 56% of 9 yrs
Jun-19.05%up 11% of 9 yrs
Jul+11.35%up 67% of 9 yrs
Aug+3.34%up 33% of 9 yrs
Sep-4.55%up 22% of 9 yrs
Oct-8.04%up 22% of 9 yrs
Nov+25.97%up 38% of 8 yrs
Dec-3.90%up 38% of 8 yrs

Since 2018, Cardano has done best in February (average +32.02%) and worst in June (average -19.05%). Past seasonal patterns don’t guarantee future returns.

About Cardano

ADA is a crypto coin running on Cardano Settlement Layer (CSL) blockchain, the first and most secure blockchain based on Proof of stake mechanism validating the transactions. Cardano team calls their proof of stake mechanism Ouroboros. Unlike Proof of Work, where miners invest energy intensive computing power to mine each block, proof of stake chooses a random miner based on the size of the stake (value). In order to generate or mint a new block, a slot leader is chosen with a probability proportional to the amount of coins this node is carrying. So one of ADA's advantages over Bitcoin, Ethereum and other similar cryptocurrencies is its energy-efficient proof of stake transaction validation system. ADA is flexible like Ethereum due to a second layer Cardano Computational Layer (CCL) which supports decentralized applications and smart contracts.

ADA was initially created by Input Output Hong Kong (IOHK), a blockchain development firm. The project was led by Charles Hoskinson who was a former co-founder of Ethereum, Etereum classic and Bitshares. Presently the ADA team consist of three organizations i.e. Cardano foundation, IOHK, and Emurgo.

The major use of Cardano is the transfer of value. Future development of applications on CCL layer can provide the easy and economical payment solution to service providers such as Uber, Upwork, and alike.

Cardano FAQ

Is Cardano bullish or bearish right now?

On the daily chart our technical summary for Cardano is strong sell, with 1 of 26 indicators signalling buy and 18 signalling sell. The weekly summary is sell.

What are the key Cardano support and resistance levels?

The nearest resistance is 0.18487 (daily pivot p) and the nearest support is 0.18003 (daily pivot s1).

What would change the Cardano outlook?

A daily close above 0.18487 would strengthen the bullish case, while a daily close below 0.18003 would favour sellers.

How has Cardano performed this year?

Cardano is down 45.16% year to date and down 68.26% over the past 12 months. Its 52-week range is 0.13820 to 0.60690.

What is the highest price Cardano has reached?

In the monthly data we track since 2018, the highest price is 3.10100; Cardano now trades 94.1% below it.

Methodology, data and sources

Price data
Binance (open, high, low, close, volume)
Last update
Nov 7, 2026 13:38 UTC · refreshed hourly
Candles
1-hour, 4-hour, daily, weekly and monthly; times in UTC
Indicators
RSI(14), Stochastic(14,3,3), CCI(20), ADX(14), Awesome Oscillator, Momentum(10), MACD(12,26,9), Stochastic RSI(3,3,14,14), Williams %R(14), Bull Bear Power, Ultimate Oscillator(7,14,28); EMA/SMA 10–200, Ichimoku(9,26,52), VWMA(20), Hull MA(9); Bollinger(20,2), ATR(14)
Ratings
Each indicator votes buy, neutral or sell; oscillators and moving averages are averaged separately, and the summary is the mean of both.
Levels
Classic, Fibonacci and Camarilla pivots from the previous session, Bollinger Bands, 50- and 200-day averages and the 52-week range.

These sections are calculated automatically by InvestingCube and update with the market. They describe what the data shows and are not investment advice. Editorial analysis on this page is written by our team.

Charts and market data by TradingView. Coin figures by CoinGecko, refreshed hourly. Prices may be delayed. This page is for information only and is not investment advice.

  • S&P 5007,376.86▲ +0.31%
  • Nasdaq 10026,989.99▲ +1.35%
  • Dow Jones51,285.73▼ -0.46%
  • DAX25,820.36▼ -1.92%
  • FTSE 10010,673.94▼ -1.01%
  • Nikkei 22557,434.77▼ -5.96%
  • Nifty 5025,030.35▲ +2.01%
  • Gold4,074.90▼ -0.94%
  • WTI oil90.83▲ +0.34%
  • Brent oil98.32▲ +0.03%
  • Silver51.94▼ -0.83%
  • EUR/USD1.1143▼ -0.67%
  • GBP/USD1.3356▼ -0.72%
  • USD/JPY158.43▲ +0.49%
  • USD/INR93.91▼ -0.59%
  • Dollar index102.28▼ -0.02%
  • Bitcoin75,911.56▲ +0.17%
  • Ethereum2,243.15▲ +0.47%
  • Solana89.95▼ -0.44%
  • XRP1.1650▼ -1.57%
  • Nvidia186.64▲ +2.78%
  • Apple342.37▼ -0.52%
  • Microsoft530.61▼ -0.99%
  • Amazon259.30▼ -0.35%
  • Alphabet284.78▲ +0.78%
  • Meta610.15▲ +0.84%
  • Tesla358.22▲ +4.23%