


- ATR shows how far a market moves, not which way.
- Use 2 x ATR for the stop, then size the trade.
- Supertrend is built on ATR; it lags and fails in ranges.
- Use Supertrend for direction and ATR for risk.
The ATR indicator is short for Average True Range. It tells us how far a market goes during an average day. This indicator will tell us the size of price movements; however, it will not tell us which direction those movements will be. When we have a high ATR value, we can expect large swings in prices. When we have a low ATR value, we can expect smaller swings in prices. This is a very easy to understand and use tool. This ATR indicator explained guide will help you understand how to use this number.
The SuperTrend indicator is a trend following indicator that shows you whether prices are going up or down. If prices are moving upwards, the SuperTrend indicator will be below prices. If prices are moving downwards, the SuperTrend indicator will be above prices. Since the SuperTrend indicator uses ATR (Average True Range), you can use both tools together.
Both are part of basic technical analysis. Both are easy to learn.
What Is the ATR Indicator and How Is It Calculated?
J. Welles Wilder made the ATR indicator in 1978. Investopedia still lists it as a key volatility tool. It starts with the true range. To get started on your analysis of a stock’s volatility, find the largest value of the three possible values listed below for every day the stock trades. The first number represents the difference between the highest price at which the stock traded during the day and the lowest price. The second represents the difference between the highest price at which the stock traded during the day and the last price it closed at the end of the prior trading day. The third number is the difference between the last price at which the stock closed at the end of the prior trading day and the lowest price at which the stock traded during the current trading day. Why use three numbers? Gaps matter. Often times stocks jump in price over night.
This is what it looks like.
A candle’s high was 52.10, its low was 50.60. It closed at 49.80. High fewer low equals 1.50. High less last close equals 2.30. Last close fewer low equals 0.80. Its true range equals 2.30. It had a gap up. If you only looked at the candle’s high and low, you wouldn’t see the gap.
The ATR (Average True Range) is a measure of the average true range of a given number of candles. A typical candle count used for this purpose is 14.
It uses Wilder smoothing, which works like an exponential moving average. New candles count a little more than old ones. Say the daily ATR is 1.20. That means the stock has moved about 1.20 a day over the last 14 days.
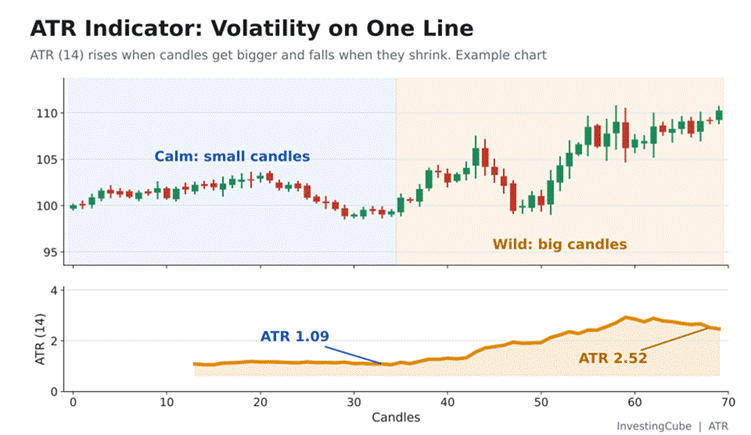
Image 1: ATR in action. On the left, candles are small and ATR sits near 1.09. On the right, candles are large and ATR climbs to 2.52. The line follows the size of the candles, not the direction of price.
How to Use the ATR Indicator: Stop Loss, Position Size, and Volatility
People have asked about using the ATR reading during an actual trade. The ATR does three things. One thing it does is indicate the level of volatility. If the ATR rises, then price movements are becoming larger. When the ATR declines, price movements are becoming smaller. However, neither indicates which direction price will move. For example, if the ATR rises from 1.20 to 2.00, then you should anticipate larger daily swings and increase the size of your stop.
The second job is the stop loss.
A tight stop will be hit by the normal fluctuations of the market. On the other hand, if you set a very wide stop, you may lose a significant amount of money. The solution is ATR. It creates a stop based on the volatility of the market. This is important because a fixed stop of 1.00 can either be considered too tight in a volatile market or too wide in a relatively stable market.
Many traders place the stop 1.5 to 3 times the ATR from entry. Our guide to order types and trade execution shows how to place that stop.
The third job is position size. A wider stop means you buy fewer shares. That keeps your risk the same. Fidelity also says ATR helps you judge how much a market moves.
Now the worked example. You buy a stock at 50.00. The 14-day ATR is 1.20. You pick a stop of 2 times ATR. That is 2.40. Your stop goes at 47.60. You will risk 1,000 on this trade. Divide 1,000 by 2.40. You get 416 shares. If the stop is hit, you lose about 998. A target of 54.80 gives you a 2 to 1 reward to risk.
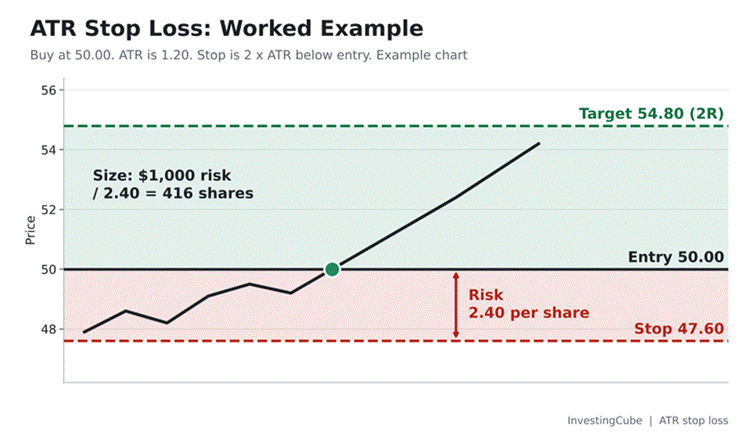
Image 2: The ATR stop loss example. The red zone is the 2.40 risk per share. The green zone is the profit area up to the 54.80 target. The label shows the 416-share position size.
Fit this into your plan. Our guide to trading risk management explains risk limits per trade. Risk a small part of your account on each trade. Let ATR set the stop distance. Do the maths before every single trade.
What Is the Supertrend Indicator and How Does It Work?
The Supertrend indicator is a line that follows price and flips sides. When price closes above the line, the trend is up. The line turns green below price. When price closes below the line, the trend is down. The line turns red above price. The flip is the signal.
Supertrend is built on ATR. It finds the middle of each candle, which is high plus low divided by two. Then it adds and subtracts the ATR times a factor. Say a candle has a high of 52 and a low of 50. The middle is 51. With an ATR of 1.20 and a factor of 3, the lower band is 47.40. The upper band is 54.60. In an uptrend, the line follows the lower band. It only moves up, never down. The Trading View help page lists the two inputs, ATR length and factor.
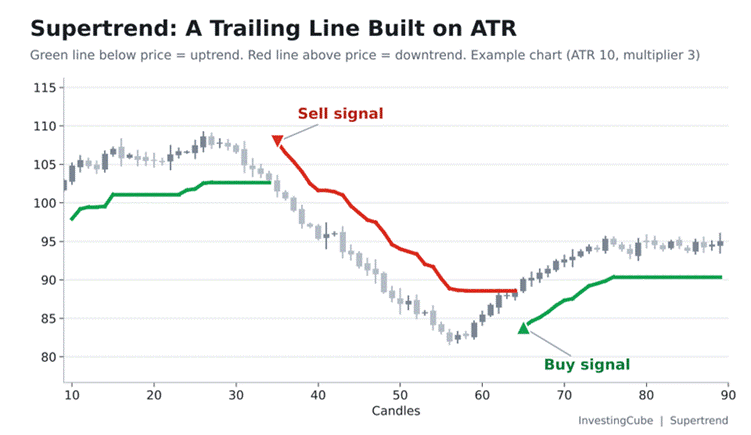
Image 3: The Supertrend line. The green line trails below price in the uptrend. When price closes under it, the line flips to red above price and the sell signal appears. Later price closes above the red line, and the buy signal appears.

How to Trade with the Supertrend Indicator
The easiest rule is simply to purchase once the line becomes green. Remain in the position long as long as the line remains green. Close out your position or open a short position when the line becomes red. The line can also act as a trailing stop. Think of the line as a trailing guide. When you are in a long position, continue to adjust your stop loss upward as the green line continues to develop.
A few habits will help. First, find the larger trend by looking at a higher time frame. Then, let the candle finish before you make your move. If a candle flips during the course of its life, it could potentially change direction. This requires patience. Let the signal develop for you. When you have identified a clear level for profits, take those profits. Do not wait for the line to flip back.
Be honest with the limitations of the tool. The Supertrend is lagging. The flip will occur once price action has taken place; therefore, you are likely to enter after price action has occurred. Additionally, the Supertrend produces a large number of false signals during a sideways market. Price will cross the line numerous times. You will incur several small losses. When the market is non-trending, avoid using the tool. Also, do not pursue a late signal. If price has been moving for a number of candles, wait until price pulls back.
Best ATR and Supertrend Settings for Different Timeframes
There is no perfect setting. The defaults are a good start. StockCharts uses a 14-period ATR in its guide. Short settings react fast but give more false signals. Long settings are smooth but slow. Test any setting on old charts before you use real money. Use these as a start:
- Scalping, 1-to-5-minute charts: ATR 7 to 10, Supertrend 7 with a factor of 2.
- Intraday, 15 minutes to 1 hour: ATR 14, Supertrend 10 with a factor of 3.
- Swing trading, 4 hour or daily: ATR 14, Supertrend 10 with a factor of 3.
- Position trading, weekly: ATR 14 to 20, Supertrend 14 with a factor of 3.
How to Combine ATR and Supertrend in One Strategy
Supertrend already uses ATR, so the two fit well. Let Supertrend give the direction. Let ATR give the risk. Keep your rules written down. Here is a simple plan. Wait for a green flip. Enter on the next candle. Put the stop 2 times ATR below entry, or just under the Supertrend line. Pick the closer one. Size the trade so your loss stays within your limit.
Add a filter to dodge sideways markets. Our Bollinger Bands guide shows how a squeeze signals low volatility. If the bands are tight and ATR is falling, skip the trade. If ATR is rising and Supertrend just flipped, the odds are better. No filter is perfect. This one removes many weak signals.
Frequently Asked Questions About ATR and Supertrend
What does a high or low ATR value mean?
When the average true range (ATR) is high, the market will move a lot. The candles will be larger, and you have more risk. If the average true range (ATR) is low, then you can expect smaller price movements, and a quieter trading environment. You should also look at what the current ATR reading is compared to that same asset’s previous ATR readings. There is no such thing as a “normal” ATR for every market; each market has its own normal ATR reading.
What is the best ATR setting for day trading?
Use 14, the standard. For a quicker read on short-term charts, some day traders prefer to use 7-10. Experiment with both. Choose the value that works best for you.
What are the best Supertrend settings for intraday trading?
A frequent selection is an ATR length of 10 and a multiplier of 3. For faster traders, they may select 7 as an ATR length and 2 as a multiplier. Higher ATR lengths provide less trading opportunities, but also less false signals.
Does the Supertrend indicator work in sideways markets?
The answer is “no”, and the reason for that is because in a range, the line will flip frequently and results in many small losses. Use this technique only when the market is trending. You may want to use a filtering tool like the ATR (Average True Range) or Bollinger Bands.
Can you use ATR and Supertrend together?
Yes, Supertrend provides the direction of the market. ATR determines where you set your stop loss and the size of your trade. Since Supertrend uses ATR to determine both its direction and placement of stops, these two indicators function together.