


- Well, the good news is that you see a HUGE share of these three ideas : price action, market structure and order flow in the market
Hi there, and welcome. It is no surprise if charts have looked like a wall of squiggles to you. Well, the good news is that you see a HUGE share of what these three ideas capture: price action, market structure and order flow. Cluster them as three different lenses on the same market. Price action tells what happened, market structure tell the story that creates the moves and order flow shows who was buying and selling. With this guide we will step through each of the lenses in simple English and demonstrate how they fit, so you can approach your next trade with a clean head.
What Is Price Action Trading?
Let’s begin with the most common question when starting out, which is of course; What is price action trading? To clarify, price action trading is simply observing the movement of price itself (which means looking at the candles, highs, lows and levels on a clean chart) rather than relying on a mountain of lagging indicators. The thinking behind this is that all news, opinion and emotion eventually have an impact on price so the most pure data message you can read is price..
At the core of price action trading are a few building blocks. Support is a zone that buyers keep stepping up to, where resistance is a zone where sellers keep piping up. More details about candlesticks: A pin bar with a long wick indicates rejection, while an engulfing candle shows one side winning decisively over the other. As shown in the diagram below, price reacts and rejects at resistance with a pin bar, drops down to support and then re-approaches the order flow with bullish engulfing candle signals buyers are returning.
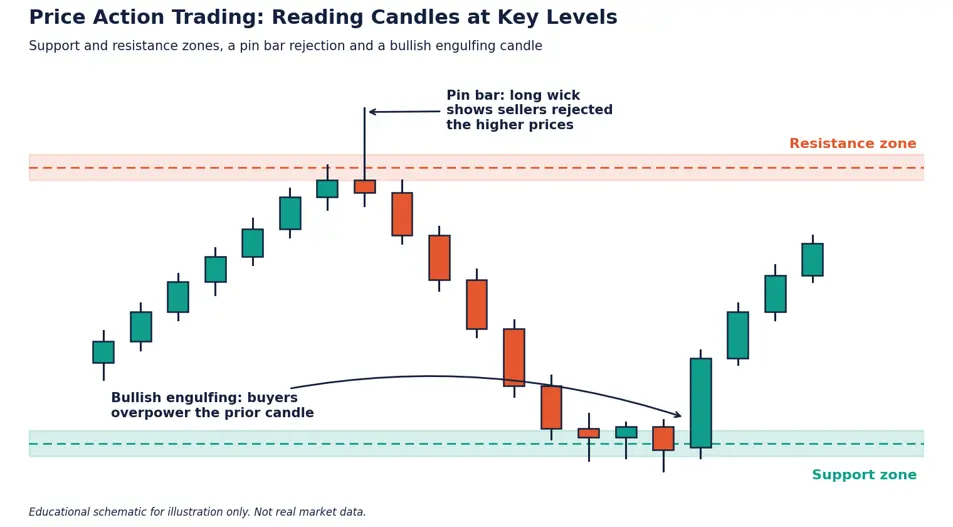
Fig 1 : A candlestick with a resistance zone interms of price at the top and support zone in terms of price at the bottom. How price action trading reads rejection and reversal without indicators; long-wicked pin bar reject a resistance, price dropped to support and is followed by large bullish engulfing candle.
Why do traders like it?
It is however flexible, available for all instruments and time frames and does not clutter your screen. The catch is subjectivity: two traders can interpret the same candle in different ways so you need rules. Record what a valid setup looks like, where your stop goes and how much you are risking. Earn a practice account first, keeping in mind that reading price live is not magic you pick up over an afternoon.
Market Structure
Price action the single word / market structure is the sentence. Zoom out and you have where price rarely moves in one direction — it swings. During an uptrend, every swing high and swing low is higher than the previous one, creating a series of higher highs and higher lows. Hence, in the opposite case of a downtrend — lower highs and lower lows.
When neither sequence is clear, price is ranging. This idea traces back to Dow Theory, and more than a century later it still helps traders decide whether to favour buying or selling.
This is how to work with market structure in practice Have been taught to get on a higher time frame (the daily chart), identify the latest swings in the high and low, and then ask yourself — is this market making higher highs and higher lows; lower highs and lower lows; or drifting sideways? Then go down to the lower time frame to find entries that fit with this broader standpoint. For example, in an uptrend, most traders wait for a pullback to the last higher low rather than buying after an extensive price run.
A common mistake is to identify every small wiggle as a swing point. You will be studying swings that matter, swings that unmistakably turned and what followed was an actual move. When you trade with structure, this does not mean that every single trade is going to be a winner but it means that you are not fighting the current and that by itself helps protect your account.
Market Structure Shift
Market structure shift is where a new trend comes into play, you are not in a forever lasting way. The market structure change takes place when the price is able to break the swing point that was keeping support for this trend. If the direction is up, that means closing under the last higher low; and if the direction is down, close over the latest lower high. Buyers may be losing control to sellers, or vice versa; it is an early sign.
Traders sometimes call this a change of character, and it often happens around a support and resistance level that finally gives way.
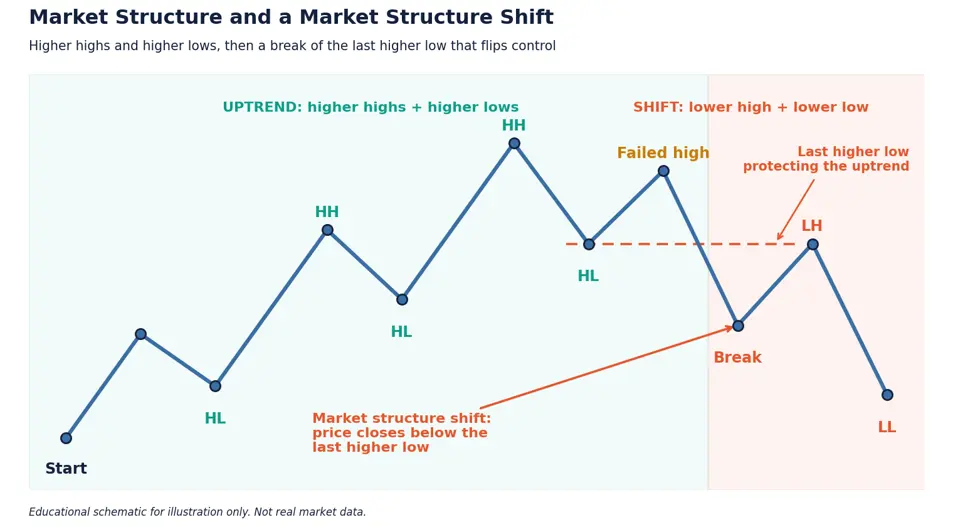
Image 2: A zig-zag price path with more highs and lows followed by a new yearly high that promptly failed. Price closes beneath our last higher low (market structure shift) and follows up with a lower high followed by a lower low.
What if I told you that it is possible to trade a market structure shift and not get burnt…
Confirmations: Look for a strong daily candle to close above the level (easy body) compared to simply a spike wick followed by an immediate snap back. And secondly, time frame – because a shift on a five minute chart counts for much less than one on the daily. Third, wait for a retest. Some price returns to the level that was previously broken after a break, and rejection at this point can provide you with low risk entry where your stop is well defined.
Lastly, a market structure change serves as an alarm and not a confirmation. Other times it breaks out and goes into a choppy range. If that is the case, take your minor loss and be done. It’s not that you should know every turn, it’s catching when the odds have shifted and revising your plan of action.

AI enthusiasm lifted the stock about 40% over three months by mid-October, yet chip and AI names have wobbled lately, which we examined in Is a market crash finally ripe? and AI chip selloff deepens as Micron slides
Order Flow Trading
If price action is the footprint, and market structure the map, order flow trading is watching the people walk. Order flow analyzes the real buy and sell orders coming into the market: How much volume trades at each price, how aggressive buyers lift offers or sellers hit bids, where big resting orders are located. These tools include the depth-of-market ladder, volume profile and footprint charts. To understand the mechanics, it helps to picture an order book as a live queue of bids and offers.
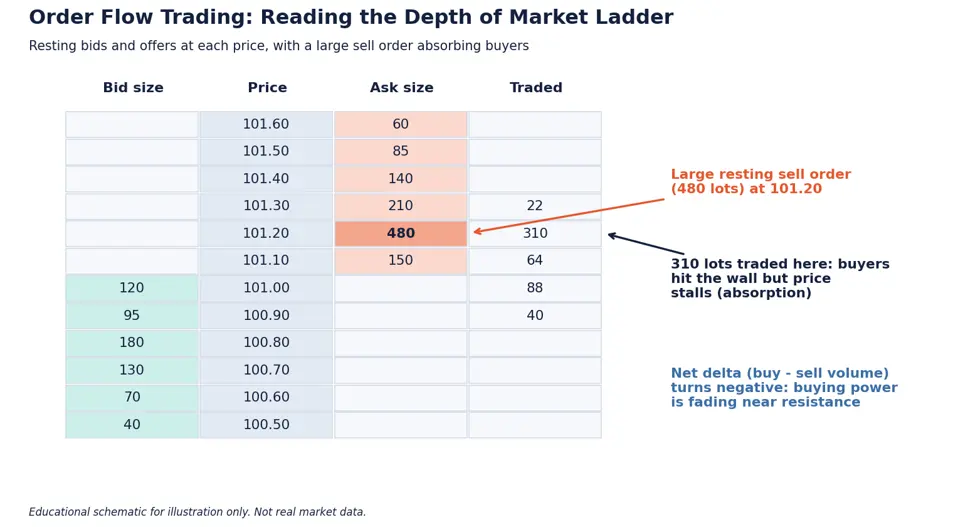
Image 3: A depth-of-market ladder with green for bid sizes on lower prices and red for ask sizes on higher prices At 101.20 a large 480-lot sell order sits, 310 lots trade but price stalls: evidence of absorption and fading buying pressure.
Is Order Flow Trading Suitable for Beginners
Yes, but gently. This works best in partially liquid, centrally traded markets like futures, where real volume data are available. Be careful with volume data in decentralised spot forex as this only represent a sample. Begin by observing the price response at a level you have previously marked using price action and structure. If price moves up to a resistance level, but buying volume dries up or a big seller absorbs all the buy orders, that is an early warning sign that the move may not last.
Order flow provides some colour; it does NOT substitute your plan. By itself, it can drag you into responding to every flicker on the screen. As a confirmation, it can assist you in determining the probabilities of whether a level is likely to hold or break.
It is easy to put the three lenses together. Step 1: Determine market bias (Higher Time Frame) through Market Structure Third, find a level and a candle signal that match with this bias using price action. Third, utilize order flow (if available) to confirm whether real buying is behind the move. Smaller risk, journaling every single trade, and getting confident with experience not excitement.
Interviews & Analysis Price Action Top Questions About price action and market structure
Is price action trading superior to indicators?
Neither is automatically better. Price action necessitates cleaner charts and helps you learn to decipher the pure behaviour, whereas indicators often serve up a quick summary of momentum or volatility. Most traders combine them, using price action for entries and one or two indicators as confirmation.
However, what is the difference between market structure and price action?
Price action refers to price movement of any size, even one candle. Market structure is simply the larger pattern created by swing highs and swing lows, determining whether the market is trending or ranging.
What is a market structure shift in trading?
Market structure shift: a break of the critical swing point which supports a trend; i.e. closing below the last higher low in an uptrend. That indicates control could be changing hands, but you need to wait for confirmation before making your move.
On the beginner level, is trading with order flow even possible?
Yes, with patience. Start only using order flow on a demo account in very liquid markets and only add confirmations to levels that you have tested through price action and structure! Disclaimer: This article is for educational purposes only and not financial advice.