



- Earlier on Tuesday sellers rebuffed the 10,890 territory for a second time last week and FTSE100 had receded -0.75% to 10,686
The Footsie at a Crossroads
London’s large index continues to be at record highs and faces rejection. Earlier on Tuesday sellers rebuffed the 10,890 territory for a second time last week and FTSE100 had receded -0.75% to 10,,686 then after finishing well in negative territory as HSBC and Reckitt disappointed during trade.
Because the index leans heavily on banks, miners and energy producers, as FTSE Russell explains, oil prices and gilt yields often steer it more than UK growth does. Our own FTSE 100 technical analysis flagged these levels before the latest wobble, so let’s see how they look now.
Reading the FTSE 100 Chart Together
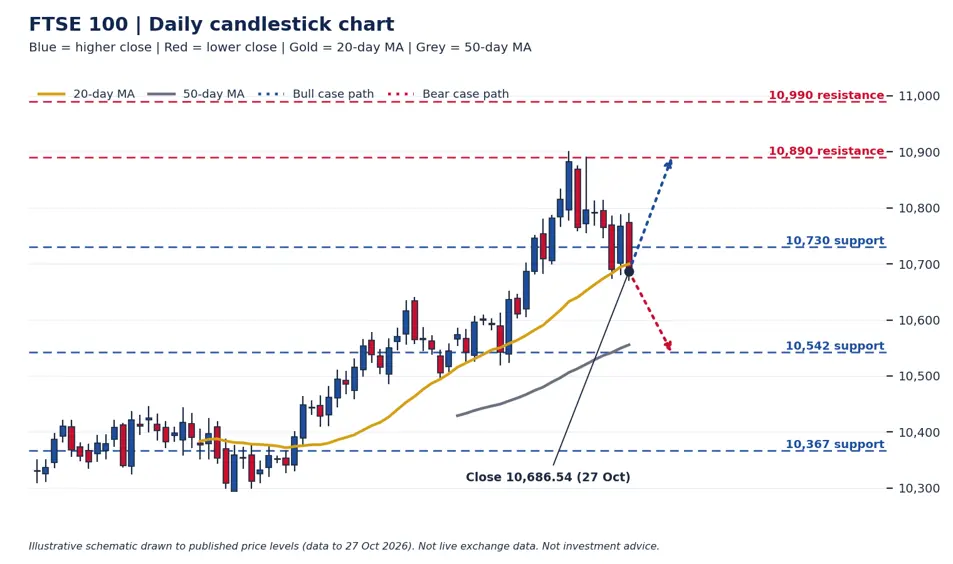
FTSE 100 daily chart: moving averages, support at 10,730, 10,542 and 10,367, resistance at 10,890 and 10,990. Illustrative chart drawn to published levels; not live exchange data.
Here is how to read it. Blue candles are days the index closed higher; red candles are lower closes, and the thin wicks show intraday extremes. The gold line is the 20-day moving average The grey line is a 50-day. Resistance up at 10,890 and 10,990 in red dashed lines meanwhile support down at 10,730,10,542 and 10,367 Observe that last candle closes beneath the 20-day average, and below 10,730—a price point which has subsequently flipped as a floor into a ceiling. However price continues to hold above rising 50-day average, so the larger uptrend is dented but not broken. The two paths traders are considering with dotted arrows: a recovery toward 10,890 or bearish journey down to 10,542.
Levels Worth Circling
Well, 10,730 is in effect the touchstone. Close back above it would indicate buyers are now back in control but 10,890 is still the real test.

Momentum cooled too: the daily RSI was near 70 before the reversal, a classic overbought warning, so profit-taking was no surprise. Meanwhile, defensive heavyweights cushioned earlier dips, as we covered in BP, Shell and GSK leading a defensive rally, and the dividend yield near 3.1% gives long-term holders reason to stay patient.
The link between banks, miners and oil
Take a step back and the narrative is really three sectors. Early movers: Banks staggered on reports private-credit lending is facing regulatory scrutiny; miners fell with copper; energy stocks steadied as crude hovers around multi-month highs. That means that when those groups move, the index moves with them and a headline can carry along the whole chart across a support line. Which is why a narrow trading range is so significant tight stop losses can be taken out by noise rather than the makings of a real trend change. Quit trusting in simply the list thus glance through oil and pound, softer sterling; briskens abroad profit among up sizeable merchants. Conduct you obtain the chart as the map and these drivers wx.
Your Game Plan
Patience is your friend here. Cautious readers should play the waiting game, opting for a day close above 10,730 before confidently buying the bounce while those already with positions should take stock of their risk if the price closes below 10,542.
Oil is the wild card, so revisit our weekly forecast note and keep an eye on the Bank of England’s rate decisions ahead of the UK Budget. This is general information, not personal advice, so size positions you can comfortably afford.