


- Whether you are pouring money into Europe or only watching global markets, it is time to take a look at the DAX Index
Why You Should Care About the DAX
Whether you are pouring money into Europe or only watching global markets, it is time to take a look at the DAX. It follows the heavyweights of Germany — SAP, Siemens, Allianz and Rheinmetall among them — and responds quickly to export numbers as well as sentiment in risk appetite. SAP was among the biggest winners while Rheinmetall fell 3.2% towards the end of trading on 21st October when it closed at about 25,650 and was up roughly +1.4% We also think Oil is a massive swing factor here and our Brent crude outlook explains why. The chart below shows where buyers and sellers stand, so let’s walk through it together.
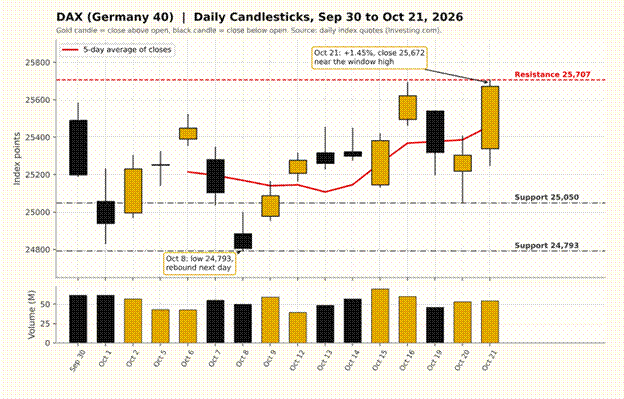
Chart note: built from published daily Germany 40 index quotes (open, high, low, close, volume) for September 30 to October 21, 2026. Extra settlement values can differ slightly from these quotes.
Reading the Chart Together
Those gold, black and red colors evoke Germany’s flag. The upper section presents sixteen September 30 to October 21 daily candlesticks. Golden candles mean the index closed above its open, while black = It closed lower. The red line is the five-day closing average, which hit bottom near 25,107 on October 13 and now stands just shy of 25,460.
The vertical axis ranges from approximately 24,650 to 25,920 points, whilst the horizontal has trading days with no weekends in between. Resistance printed at 25,707 — the high from October 21 — is marked by a red dashed line. Dashed, grey lines denote support at 25,050 and 24,793 while two call-outs note the low on October 8 and the close of 25,672 on October 21. Volume is in millions for this panel, which hits a high of 69.5 on October 15th and low of 39.3 on October 12th in the lower panel
The Candle Tells You What to Do
Three things stand out. A black candle closed on October 8th by closing at 24,807 and the next day a gold candle rose by 1.1% which is nothing but classic rebound. On October 19 a black candle cancelled out all of Friday’s gain yet there were swing lows higher than the 25,050 low on October 20.

Then October 21 opened at 25,339 and closed at 25,672, just under the window high and within reach of August’s record run. Volume of 54 million was only mid-range, so don’t assume conviction yet.
Seven of the sixteen sessions closed more than 1% away from the prior close, four lower and three higher. That is a nervous market, but one still finding buyers on dips.
A Practical Game Plan
For those already in, a show of strength above 25,707 would be positive and set the stage for a test of August highs near 26,570—some +3.5% higher. The 24,793 marks will come back into play with a close below 25,050 so it is a sensible place to re-evaluate risk.
Watch AI-linked tech weakness, French unrest, euro-area inflation of 3.8% and Iran talks that could cool oil.
Rather conservative traders are likely to wait for a close above 25,707 on increased volume before taking action. During October: More nimble traders may eye the five-day average in 25,460 as a pull-back zone while 25,050 remains intact. Just keep in mind one good day does not a trend make, so allow a few more sessions for the index to become committed. This is not personal advice; it is just general information so only you can decide what is best for your situation.