


- The Hang Seng Index (HSI) is stuck between 24100 and 24300 bruised by another tech-led wobble and the drama continues
Introduction
The Hang Seng Index (HSI) is stuck between 24100 and 24300 bruised by another tech-led wobble. As the 50-day average crossed below the 200-day in mid-September, and it is very much an index in an evident downtrend on the daily chart. Our note on China growth versus the global tech selloff explains why mainland sentiment and global technology weakness keep pulling in opposite directions.
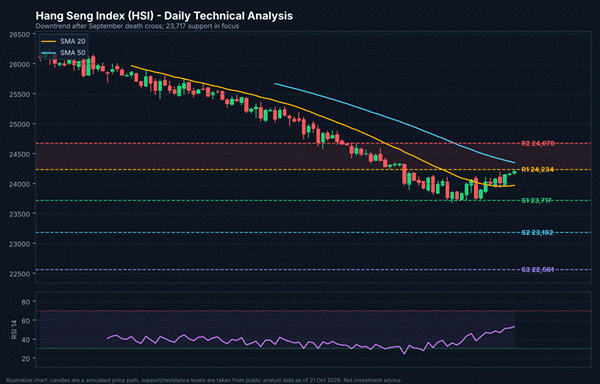
Hang Seng Index daily chart with support and resistance levels, moving averages and RSI (illustrative).
Key Support and Resistance Levels
The immediate resistance is 24,234 then at that level, you enter the next barrier on 24,670. Above that, the five-hour chart places a 200-period average near 24,880 as well as dynamic resistance from the Ichimoku cloud on top of a level bulls have seem unable to clear. On the downside, 23,717 supports the lows of 2 and 8 October. Such a break would eye 23,182 before the 26 June low at 22,561 — just shy of the 22,545 support being monitored by other analysts.
Indicators and Pattern
On its 15-minute chart, the price could form a bull flag after being rejected at 24,107 (strongly resisted weekly close) with SuperTrend support closing at 23,906. Level around 14 in ADX means weak trend strength, which indicates choppy trading between 23,900 and 24,200 instead of a clean break out. This tight zone mirrors the action when the HSI slid as Alibaba and tech stocks weakened ahead of China’s market reopening.
Market Drivers
Technology stocks carry heavy weight in the index, so semiconductor and artificial intelligence sentiment matters. Hawkish Federal Reserve expectations and elevated oil prices add pressure, a theme visible when the HSI closed at 25,274 as oil neared $100 in September. The only potential near-term catalyst to the upside would be a new round of stimulus out of Beijing.

Trading Scenarios
Bull case: a daily close above 24,670 would pierce the descending trendline which would clear road paving towards 25,000 where September’s 25,274 close resides. Bearish case: A close through 23,717 would confirm the downtrend with targets of 23,182 — followed by 22,561. Our earlier
Hang Seng Index price prediction outlines the longer-term roadmap.
Risk Management
Patience Matters Because The Index Is Positioned Inside A No-Trade Zone We would need to see a move above 24,234 in large technology names in Hong Kong on solid turnover and that would be an early sign the selling pressure was easing. Multiple failed attempts at that level would only add to the bear flag and increase the likelihood of testing 23,717. Stops should be above the other side of the 23900-24200 range, and position sizes should correspond to the index’s recent daily moves. The patient can use wait for the SuperTrend line barely above 23,906 to trigger: a close below would confirm the pattern resolved lower; above so 24,670 and we could argue correction has run its course.
View: bias remains bearish as long as it is below 24,670. What traders need to do is keep an eye on 23,717 closely as a firm break in either direction set the tone for the rest of the month. A pullback back above 24,670 would turn the view neutral. Meanwhile, traders can short rallies until proven otherwise and watch for dips towards support.