



The FTSE 100 fell 117.21 points or 1.08% to close at 10,764.69 on 19 October, halting a three-session winning streak. Your next index opened near 10,882, seen hitting as high as 10,889.90 before rolling back once more to reject the same 10,890 resistance analysts pointed out before the open.
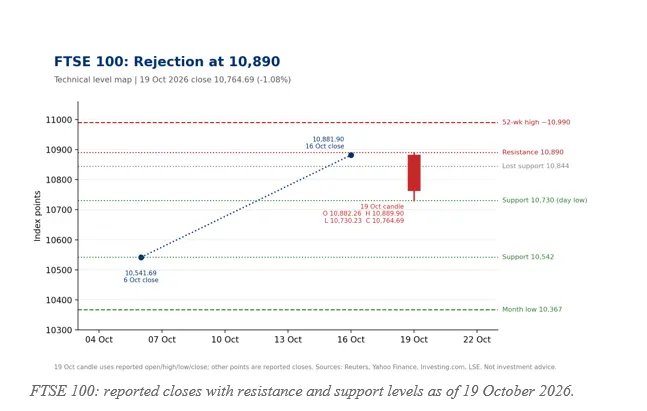
FTSE 100: reported closes with resistance and support levels as of 19 October 2026.
The Bigger Picture
Over the last twelve months, the index fluctuated between approximately 9,400 and 10,990 and is up 14.5% on yearly bases. Which puts Monday’s drop into pullback territory instead of collapse zone, but banks, miners or oil being too close to record should offer little room for disappointment. Demand from internationally-focused income global investors attracts a relatively high dividend yield of 3.11% at the moment, while a weaker pound tends to boost overseas earnings for large index constituents when per dollar accounted for at levels close to 1.33 vs sterling.
What Drove the Reversal
Barclays lost 3.5% after the Financial Times reported the Bank of England was investigating a range of private-credit loans made by the lender, and also dragged down other banks with it lower by 2.3%. Copper’s slide led to 4.1% and 3.3% losses for Anglo American and Glencore respectively. The FTSE 250 fell 0.6%, breaking a six-day winning streak. Concerns about inflation were still being fueled by Brent which was now headed back to $107.
Sector Watch
Banks, miners and Defence stocks surrendered about 2% in early trade while energy shares were among the last group of gainers highlighting once again how sensitive the index is to oil prices. Note that Barclays is a big name, so a long regulatory story may drag the benchmark into support. Event risk this week also includes US tech earnings for Tesla and Meta. The relative FTSE 250 fall indicates domestic cyclicals probably outperformed global miners and banks.
Key Technical Levels
On the upside, we expect 10,890 to provide resistance before approaching the weekly high of about 10,990. Support comes in at 10,730 the day low then 10,542 (6 October close) and then 10,367 last month low. Above 10,844 the support lost on Monday would be a very early indication buyers are buying back in control.

Before the open, one analyst’s daily RSI reading of about 70.5 flagged overbought conditions, so the reversal fits a profit-taking pattern. Our FTSE 100 forecast note for the week frames the wider range.
Fundamentals Behind the Chart
The index offers a dividend yield near 3.1%, supported by record payouts that face a gilt-market test, as discussed in our dividend yield analysis.
Defensive heavyweights such as BP, Shell and GSK cushioned earlier dips, which we covered in the defensive rally they led. For a broader view of oil, gilts and sentiment, read our FTSE 100 case study of oil, gilt yields and risk sentiment.
Trading Scenarios
The bullish case requires a weekly close past 10,890 with 10,990 targets as the record zone. The support is at 10,730 and a break below brings 10.542 into play. Risk appetite dictated by oil, gilt yields and US tech earnings; base case consolidation 10,730-10,890 Trend followers will pay attention to any higher lows hold -> since the index is about 14.5% up over twelve months. With only a 160 point range for the day, tight stop-losses therefore risk being turned over by noise rather than real trends as well.