


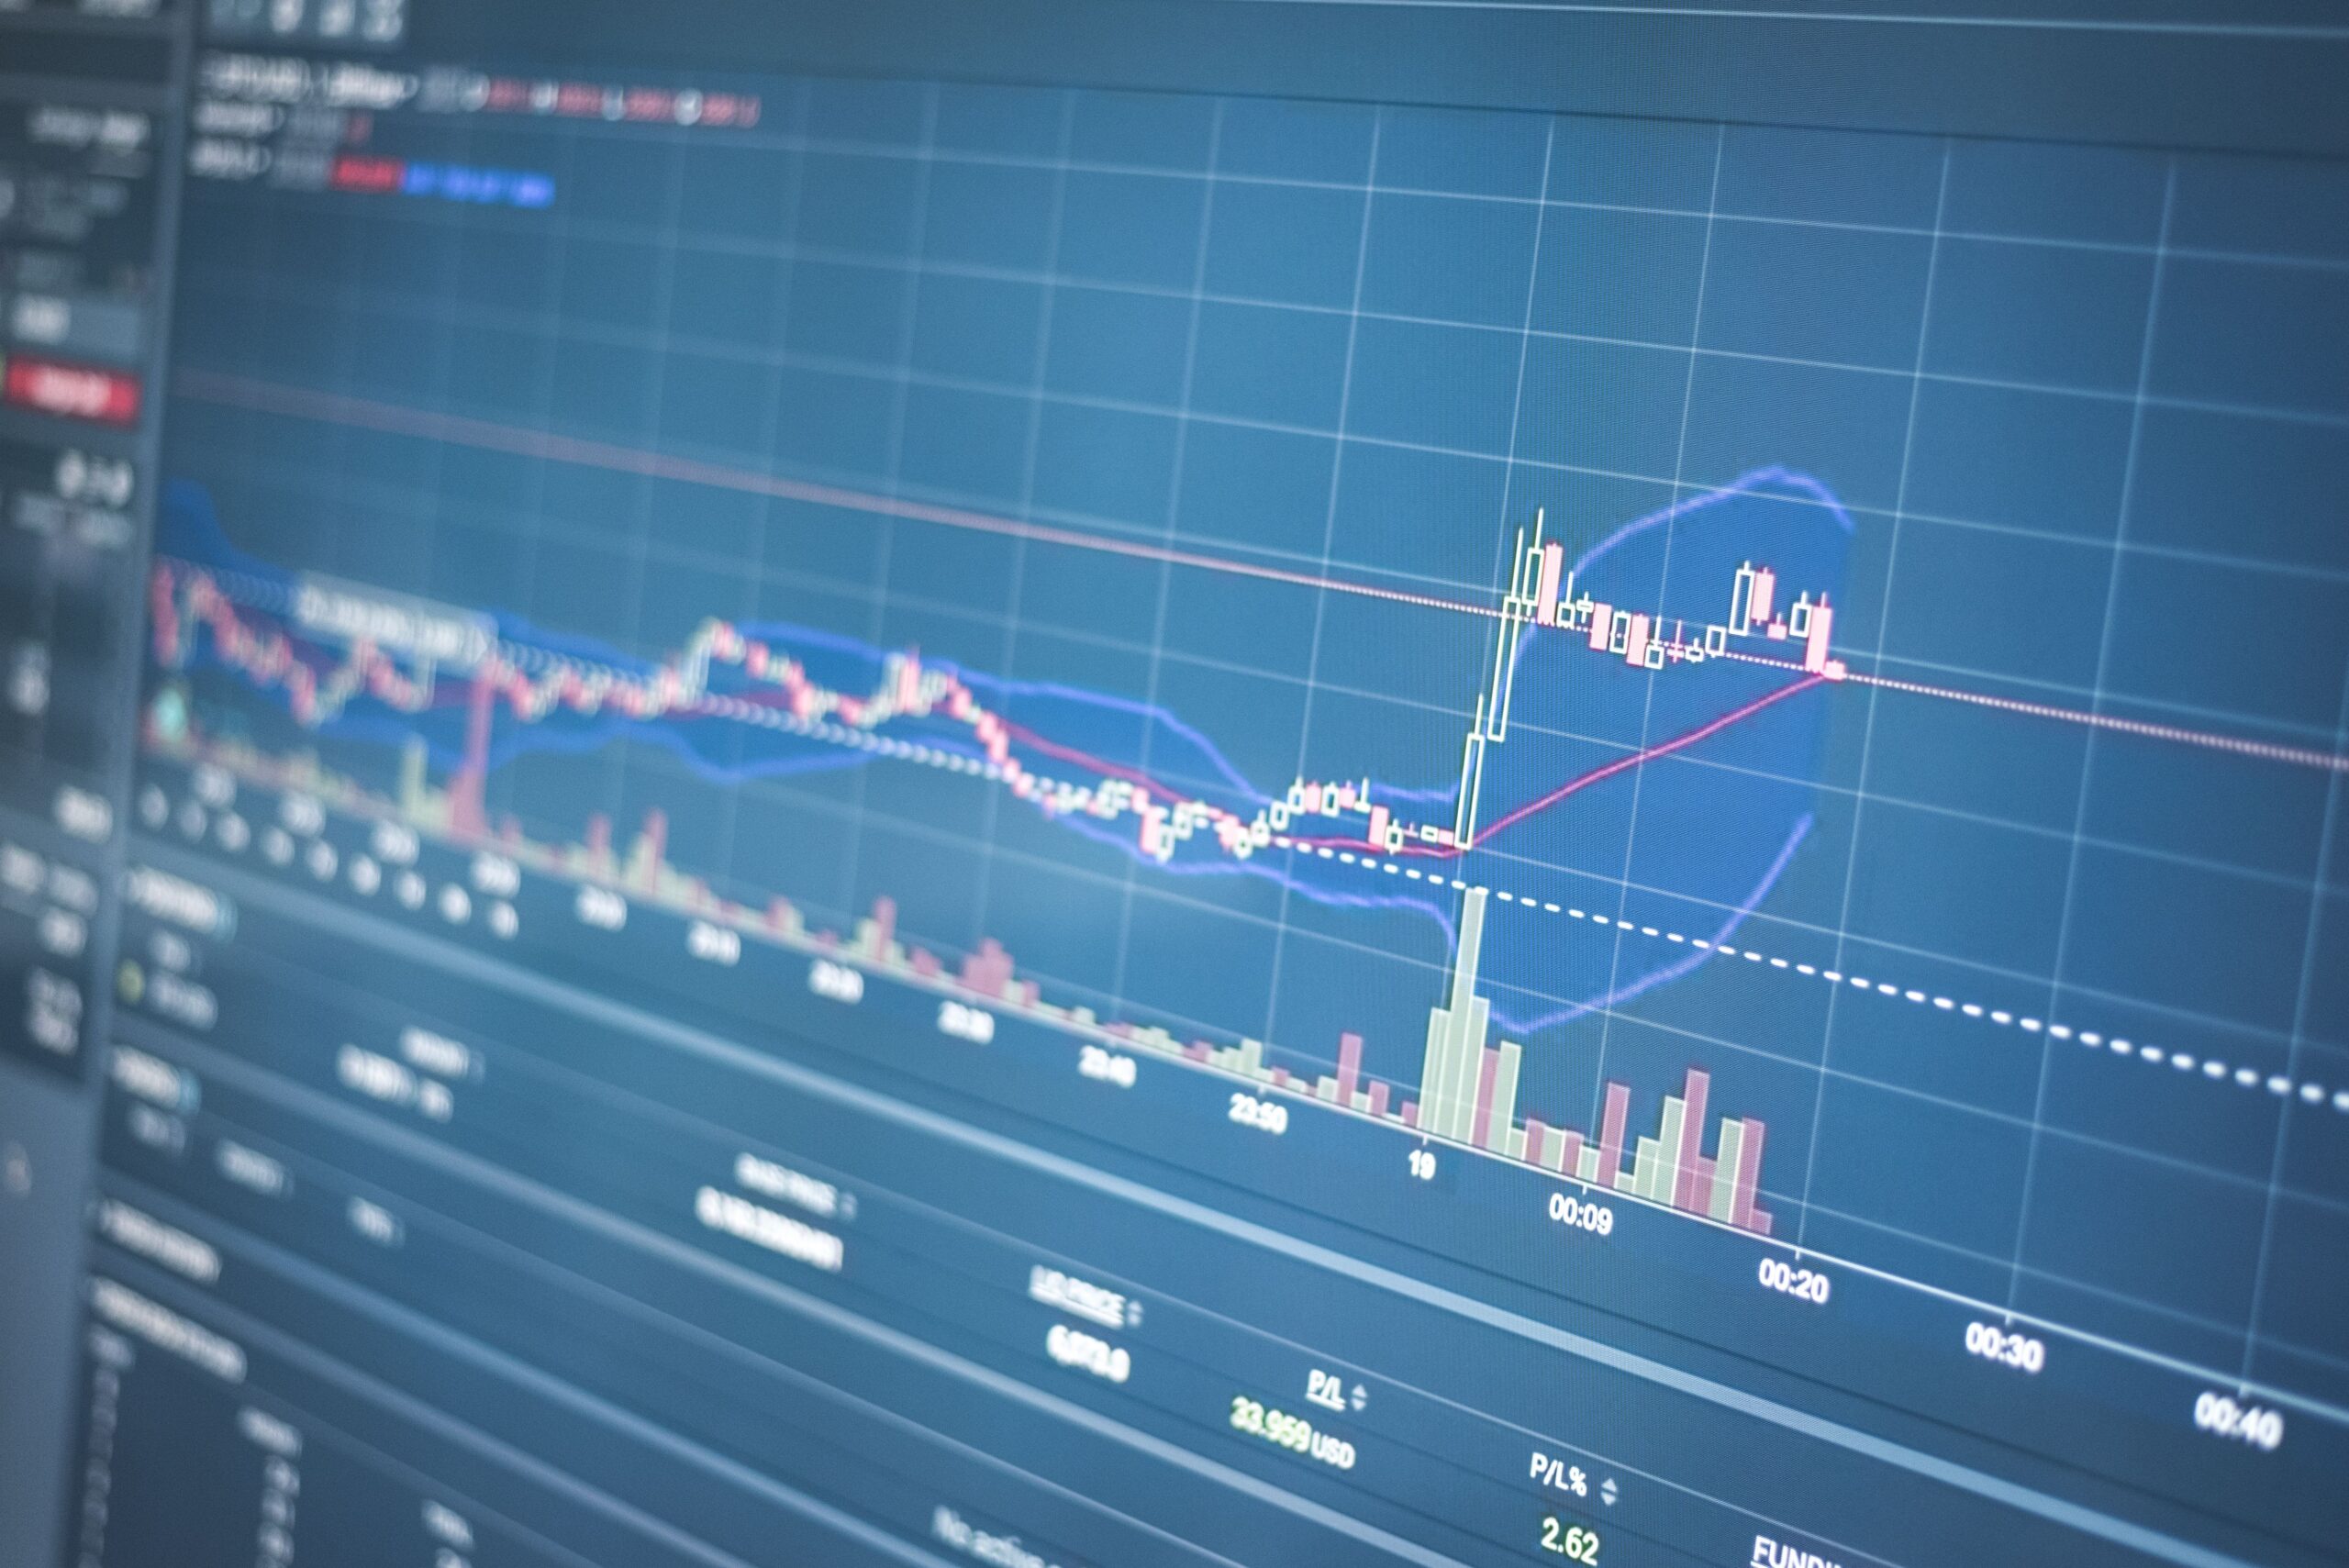
- The bands use a 20-day moving average and have lines at two times the standard deviation above and below that line, and as such will expand and contract based on the amount of price volatility.
- The price of the stock near the outer bands indicates both relative high prices and relative low prices. The "squeeze" is indicative of a potentially large price movement in the future; however, it does not provide any indication of which way that price movement may occur.
- In addition, use mean reversion within a range, pullbacks to the middle of the band during a trend, and confirmed breakouts when a squeeze occurs.
- The default settings for the bands are 20 and 2. Traders who trade short-term may use 10 and 1.5, while those who trade long-term may use 50 and 2.5. Traders can use the bands with RSI, MACD, Volume, and Support Levels.
Prices do not simply rise or fall in an exact pattern; rather, they fluctuate, pause, accelerate, and occasionally become almost stagnant. The Bollinger Bands provide us with one of the most effective methods for observing these shifts in the market’s behaviour on a price chart. As the bands expand or contract as a result of the volatility (or lack thereof) of the market, they create a “flexible” boundary around the price. When the market is volatile, the bands widen, and when the market is stable, the bands narrow.
This simple behaviour provides us with a great deal of information regarding risk, momentum, and potential reversal points. This article will help you understand how the bands operate, how to interpret them, what types of strategies traders employ with them, what settings are appropriate for various time frames, and how to combine them with additional indicators so that you do not depend upon just one.
What Are Bollinger Bands and How Do They Work?
In the early 1980’s, Bollinger Bands investor- John Bollinger. Bollinger Bands comprise of three different lines. The central line is a 20-period simple moving average of price.
. The upper band sits two standard deviations above it, and the lower band sits two standard deviations below. A fuller definition is available at Investopedia, but the logic is straightforward.
A measure of the spread of prices relative to their average value, standard deviation, will rise when price fluctuations increase (bands widen), and decline when price movement is minimal (bands contract). Therefore, because the bands automatically adjust to changing conditions in the market, a contact with the upper band in a period of relative stability will have a significantly different meaning than a similar contact in a highly volatile period.
A bell-shaped distribution has about 95% of its data points within two standard deviations of the mean. However, because most real-world markets do not follow a perfect bell curve, prices may (and often will) go outside of these upper/lower limits. Use the upper/lower limits as an indicator for potential relative highs and lows, but do not use them as a guarantee that price must reverse.
How to Read Bollinger Bands: Upper Band, Lower Band, and Squeeze
The first image displays the candles. The central bank is located in the middle. The upper band is above the candles. The lower band is below the candles. A shaded region is present between the upper and lower bands.
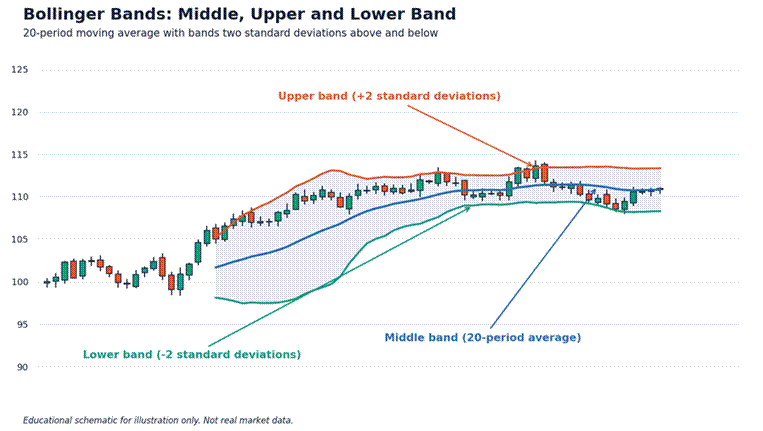
Image 1: A candlestick chart with a blue 20-period middle band, red upper band and green lower band shading the area between them. Labels indicate each band, illustrating how price moves within the envelope and sometimes reaches or crosses the outer lines.
Learn ahead
The following is the reading guide. If price is close to the top band, then it is above average. If price is close to the bottom band, then it is below average. When there are ranges, the extremes may be used to identify when price will turn. However, if there is a strong trend, then price may follow one band for several periods (candles). This behaviour is known as “walking the band” and is indicative of strength, not exhaustion. The middle band serves as dynamic support during an uptrend, and dynamic resistance during a downtrend.
The “squeeze” is well known. The squeeze occurs when the bands reach their lowest width for several months, indicating that there is little or no volatility. Since volatility tends to move in cycles, the quiet periods will usually be followed by periods of rapid expansion.
The Stock Charts Chart School explains this using bandwidth, a measure of the distance between the bands.
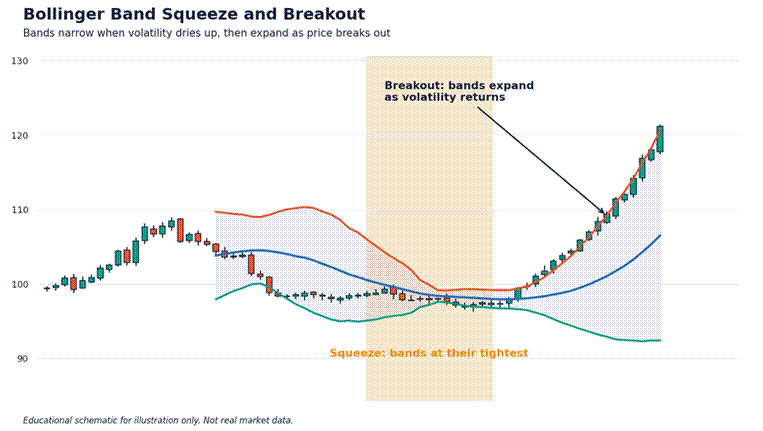
Image 2: A price graph with Bollinger Bands contracting within a greyed-out “squeeze zone” while trading in a flat range; subsequently, price moves higher, causing the bands to widen rapidly. This illustrates that periods of low volatility are frequently succeeded by significant price action.
Do understand
A “squeeze” is an indication that a large price movement is likely to occur in the future, however it does not indicate which way the market will go. Many traders use the “squeeze” technique by waiting until a candle closes outside the bands and then enter the market in the same direction. They place a stop-loss order at the opposite end of the squeeze range. Since false breakouts are common, confirmation of the breakout is essential.
Another reading technique that you may find useful is to observe the bands over both a short and long-term period. If there is a “lower band” touch on a 15-minute chart within a larger “daily uptrend” this can be seen as a potential buying opportunity. Conversely, if there is a “lower band” touch on a 15-minute chart during a larger “daily downtrend” this can be a sign that there will likely be further downside movement. Higher time frames create the environment, and lower time frames provide the details of what is happening each day. In addition to observing the band touches, you should also pay attention to the slopes of the bands. When the bands tilt upward in unison, it indicates that the market is moving higher.
On the other hand, when the bands point downward in unison, it suggests that the market is moving lower. Flat, parallel bands indicate that the market is trading in a consolidation phase (i.e., a “calm” range). By combining your analysis of the bands’ slopes, widths, and positions you will gain a more complete understanding of what is occurring in the market as opposed to simply focusing on the individual band touches.
Bollinger Bands Trading Strategies
Three different techniques are used to enter trades with Bollinger Bands. The first is “mean reversion” and can be applied during a sideways market. Traders who employ this technique will look to buy at the bottom band of the Bollinger Band, and then sell when the price reaches the top band. They target the middle band for their exit point. The second is “trend following” and is most effective during a strongly trending market. Instead of looking for opportunities to fade the outer bands, traders employing this technique will look for opportunities to enter a trade based on pullbacks to the middle band. Finally, the “squeeze breakout” as discussed earlier is designed to capitalize on the beginning of a new price action.
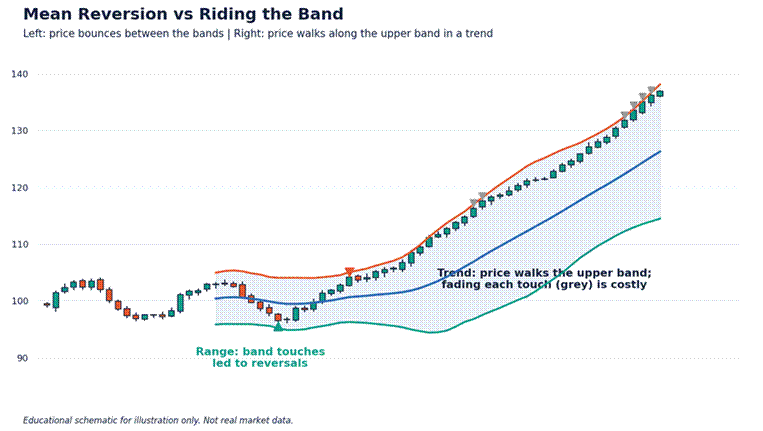
Image 3: Two-part price chart. To the left side of the chart is a price action that is bouncing back and forth within a range. There are green dots indicating when the price touched the bottom band of the range and red dots when the price touched the top band of the range. To the right side of the chart is a price action that is walking up the top band of the range as part of an uptrend. This illustrates why it may be expensive to fade each touch of the band.

Also important
In the last image there are three ways to trade. One is similar to the first two methods used. When trading on the left side of the chart, touches of the bands resulted in mean reversion. This means that trading on this side of the chart was profitable. Trading on the right side of the chart resulted in prices moving towards the upper band. Anyone who sold at each touch of the upper band would have lost money. A good way to determine what type of market condition exists before trading is to look at the angle of the middle band. If the angle of the middle band is zero then the market is likely a range. If the angle of the middle band is very high or very low then the market is likely a trend.
John Bollinger has also identified other types of patterns (e.g., the W-bottom pattern) that indicate possible reversals. In the W-bottom pattern, price creates a new low beyond the bottom of the band. Price then rallies and creates another new low, which is located inside of the band. This creates a divergence in price movement, suggesting that there may be a change in direction. Regardless of the pattern used to identify potential trades, it is important to establish your stop-loss prior to entering each trade and limit your risk exposure on each trade to a small portion of your trading capital.
Best Bollinger Bands Settings for Different Timeframes
Bollinger’s recommended setting is a 20-period average with 2 standard deviations, which works well on most daily and four-hour charts. Bollinger also recommends that you adjust both parameters at the same time: if you are analysing a short-term trend, then use a 10-period average with 1.5 standard deviations. On the other hand, if you are analysing a long-term trend, then use a 50-period average with 2.5 standard deviations.
You can read his guidance on BollingerBands.com.
Why bother to modify them? The shorter the period, the closer the bands will be to the price of the stock, resulting in a quicker reaction time to changes in the stock’s price, and therefore more touches of the bands, and more “noise” (false signals). Conversely, the longer the period, the smoother the bands will appear, and thus there will be fewer, yet more reliable signals. Traders who operate as day-traders typically opt for faster-acting settings when utilizing 5–15-minute charts. On the other hand, traders operating as swing-traders or position-traders typically utilize the default settings, or even slower-acting variations.
Avoid continuously making adjustments to settings. Pick one, test it with at least 50 historical examples from your preferred market, then evaluate. If the default performs as well as the new setting, then use the default; as simplicity will enable you to make decisions quickly and allow for easier evaluation of your results.
Combining Bollinger Bands with Other Indicators
Bollinger bands provide a description of the amount of variability in prices, as well as an indication of where prices are relative to their moving average. However, they do not provide any information regarding how fast prices are moving (momentum), nor do they provide any information regarding the quantity of stock traded (volume). Therefore, it is logical to use Bollinger bands in conjunction with other indicators that can provide this type of information.
The relative strength index can confirm whether a band touch comes with overbought or oversold momentum. The MACD will let you know if behind a squeeze breakout is true strength.
Support and resistance zones provide additional context to your trading decisions. When a lower-band touch aligns with a major support zone, it has greater significance than if it were a touch in “open” space. Also, using a trend filter, like only entering long positions when prices are above a 200-period moving average, will allow you to remain aligned with the larger trend.
A good list of items to consider when trading includes: determine what type of market you will be trading in, look for a band signal (i.e. moving average crossover), confirm with at least one other technical indicator, use a stop loss, and size your trade such that if it goes against you, the loss does not feel too painful. It is much easier to trade off of three agreeing signals as opposed to only one line.
Frequently Asked Questions About Bollinger Bands
What are the best Bollinger Bands settings?
Most traders will find that a standard 20-period average combined with two standard deviations is effective. However, some traders who are trading over a short time frame might prefer to use a 10-period average with 1.5 standard deviations, whereas others that are trading over a long-time frame could select a 50-period average with 2.5 standard deviations. Always test any adjustments to your trading strategy against historical data prior to committing capital.
What does a Bollinger Band squeeze mean?
A squeeze is when the bands have become unusually narrow, which is an indication that there is very little volatility. Usually, this will be followed by a large price movement, however; it does not indicate whether the price will go up or down. Wait for a clear breakout and use a stop loss to help protect your capital.
Is Bollinger Bands a leading or lagging indicator?
it was developed using a moving average and standard deviation based upon past prices. Although the width of the bands may give us a slight early warning that there has been an increase in volatility, we should use these bands as a form of confirmation and context rather than for forecasting.
Can you use Bollinger Bands for day trading?
Yes. Day traders frequently use these indicators in 1–15-minute charts using faster parameter settings than relate to longer-term charts. In addition, they frequently use a trend indicator from a larger time frame as a filter. Since day trading involves rapid decisions based upon short-term price movements, day traders should expect more “false signals” when trading in smaller timeframes. Because of this, traders limit the size of each trade, and that they practice using these indicators on a virtual trading platform prior to executing real money trades. Please note that this article was created for educational purposes only and does not constitute financial advice.