



- USD/ZAR near 16.68, capped by 16.80 resistance.
- Support sits at 16.50, 16.30 and 16.00.
- Fed hike bets, oil and gold steer the rand.
The Rand Meets a Stubborn Ceiling
No single currency pair is as testing to one’s patience as the USD/ZAR. After being traded close to 16.00 per dollar in early September, the rand fell to approximately 16.70 and was at about 16.68 on Monday, just below the 16.80 resistance level which has acted as a ceiling for all of its rallies since mid-year.
Our USD/ZAR climb analysis describes how persistently buyers have pressed that level. Because South Africa depends on commodity exports, the rand often follows global risk mood, as the South African Reserve Bank frequently notes. Let’s see how it looks on the chart.
Decoding the USD/ZAR Chart
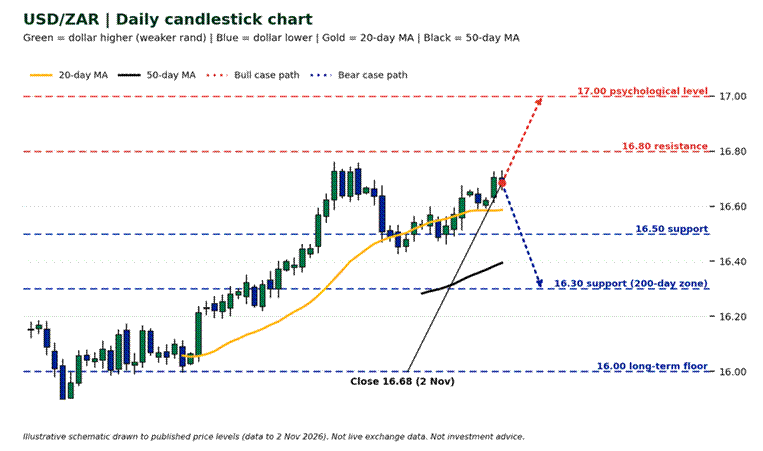
USD/ZAR daily chart: moving averages, resistance at 16.80 and 17.00, support at 16.50, 16.30 and 16.00. Illustrative chart drawn to published levels; not live exchange data.
Green candlesticks mark days the dollar closed higher, meaning a weaker rand; blue candles mark lower closes. The gold line represents the 20-day simple moving average and the black line represents the 50-day simple moving average; currently, price is well-above each. The red dashed lines represent potential resistance areas for the stock price to move higher (i.e., at 16.80 and 17.00), whereas the blue dashed lines represent potential support areas for the stock price to decline further (i.e., at 16.50, 16.30, and 16.00). In the bottom left corner of the chart, you can see that the stock dropped in September toward 16.00, and then continued on a very consistent upward trend.
You can also see multiple candles pushing toward 16.80 but being rejected multiple times. This type of price action is referred to as “repeated rejection.” Finally, the dotted arrows show us where we would go if the bulls were to take over and push the stock price to 17.00 or if the bears were to push the stock price down to 16.30.
What Moves the Rand Now
The dollar has the edge. Traders price roughly an 84% chance of a December Fed hike, according to the CME Group Fed Watch tool, and softer gold and platinum prices removed some support for the rand. Higher oil also hurts, because South Africa imports energy. Our reports on the pair breaching two-month highs and the defiant rand testing 16.50 show how quickly sentiment swings.
Why Rejections Matter
The reason why the dollar-rand exchange rate has not collapsed, even though each time it reaches 16.80 sellers (likely exporters, bond investors, and traders who expect a strong rand) come out to sell, is because each time the pair declines, buyers continue to step forward. This tug of war between buyers and sellers typically results in a clean break, and the trend will usually be in line with the broader macroeconomic environment. For example, high U.S. interest rates and a general risk-averse environment support the dollar; conversely, an unexpected dovish move by the Federal Reserve, an increase in gold prices, and calmer market conditions would support the rand. Many traders use range trading strategies while this tug of war continues, buying at or near support levels, selling at or near resistance levels, and using small stop losses.
If you have to pay foreign currency invoices as part of your business operations, you may want to hedge in increments instead of trying to wait until you find a perfect rate. Regardless of what type of strategy, you choose to employ, it is important to develop a written plan prior to initiating any trades and to stick to that plan.
Your Game Plan
Patience will be rewarded. A daily close above 16.80 may signal that the price could move higher toward 17.00. However, if the price falls below 16.50 it may indicate that buyers are becoming exhausted and that the 200-day moving average (at approximately 16.30) could serve as a support level. The AGOA Trade Review and Local Elections occurring this week create potential event risks. Also, domestic data like Producer Inflation will provide additional insight.

published by Statistics South Africa, and the SARB rate hike reaction matter too. This is general information, not personal advice.
FAQs
Why can’t USD/ZAR break the 16.80 level?
Since early July, there has been a pattern where sellers of the U.S. Dollar (for example, exporters and those who purchase bonds) continually step in near the 16.80 level, while at the same time buyers continue to enter the market on price pullbacks. Until a clear winner emerges from either of these groups, the 16.80 level serves as a cap.
What are the main support levels for USD/ZAR?
Support is currently sitting at 16.50 and 16.30 (the 200-day average) with 16.00 being a longer-term base.
What moves the South African rand?
The primary influences on the Rand’s value are the U.S. Federal Reserve’s projected interest rate increases, global oil prices, global gold and platinum prices, and overall global investor confidence/risk tolerance. Oil price increases will negatively affect the Rand as South Africa imports its energy needs. Conversely, increases in gold prices typically result in appreciation of the Rand.
What would signal a USD/ZAR breakout?
A closing price of over 16.80 each day (preferably sustained for at least two days) would allow the market to move towards 17.00. This article is meant as an educational resource only and does not constitute financial advice.