



- First trading via CFD allows traders to bet on price movements without owning the underlying asset as described here.
First trading via CFD allows traders to bet on price movements without owning the underlying asset. Whether you track currencies, stock indices, commodities or individual shares — technical analysis can support you find your next trade set-up.
However, more than simply identifying a bullish candle or tracking down a breakout in price needs to take place for successful trading strategy. Understanding the concept of support and resistance, moving averages, momentum indicators & leverage risk are essential for traders.
For a practical introduction, see Investing Cube’s guide to CFD brokers, which explains how contracts for difference work and highlights important considerations when choosing a trading provider.
Technical Analysis Chart: Understanding the Market Structure
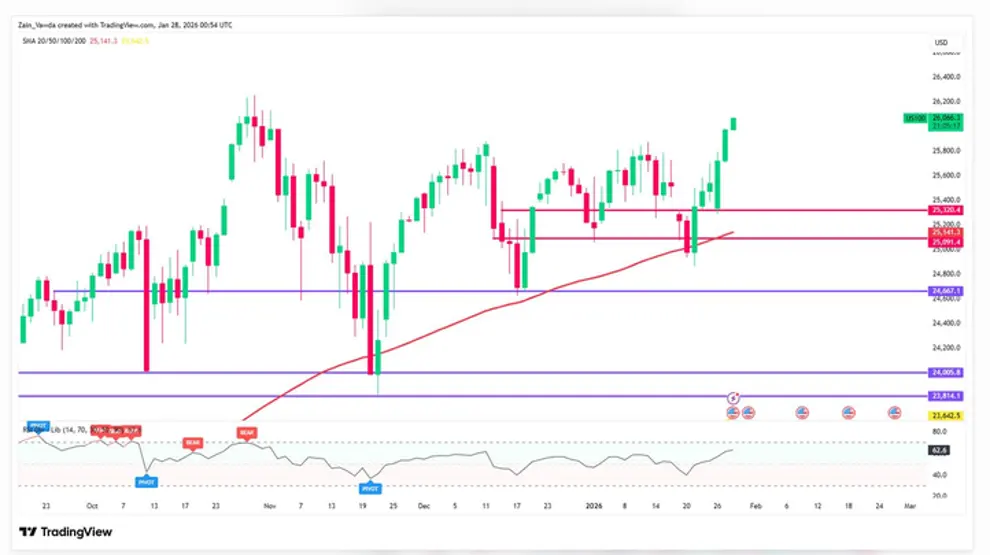
Figure 1: Example CFD Technical Analysis chart with candlesticks, MA’s, Support, Resistance and RSI This is for educational purposes only, and not a live market chart.
We have a chart describing some imaginary market that goes through all these phases. They go up, meet resistance, pull back to support and recover. Here, we use the blue line to depict a moving average for a shorter time period and the orange line for a longer term. The lower panel shows the RSI with reference levels at 70 and 30.
Combining these components assists traders in determining market direction, potential entry points and understanding when a trading set up may begin to weaken. None of them would single handedly be able to predict the next move of price.
Reading Support, Resistance and Price Action
In technical analysis, the first thing to do is to find out how far buyers and sellers have influenced a market. A support level is an area with perceived buying interest and a resistance price area may be characterized as an area with increased selling pressure.
So, what will happen for price to break resistance?
A confirmed breakout can signal that buyers are taking charge. Instead of the brief intraday move, traders need to await a candle closing above resistance. More confirmation can come with a retest when the previous resistance emerges as support.
Failure and a break another story. If price rises above resistance but immediately gets rejected back to the downside, it is possible building pressure on taking a loss for these buyers and may be targeted before decline comes.
This approach is consistent with the importance of clearly defined trading levels discussed in InvestingCube’s recent FTSE 100 technical analysis, published on October 21, 2026.
MAs and RSI: Momentum Indicators
For any trader, moving averages serve the purpose of identifying if a trend is in place. In the chart, for instance, the blue line represents a fictitious 20-period moving average whereas, the orange line is 50-period moving average.
A common bullish indicator you will notice with moving averages is when the shorter average crosses above the longer average: this can signal a momentum change or improvement [Figure 5]. If both averages trend higher, the trend might be gaining strength. On the other side of things, it a down turn or bearish crossover can indicate waning buying pressure.
NOTE: however, moving averages are lagging indicators. That reacts late to historic levels and is likely to build false signals on flat markets

The second, lower panel illustrates the Relative Strength Index (RSI), which measures the speed and magnitude of recent price movements.
An RSI of more than 70 is usually characterized as being overbought, and an RSI below 30 indicates oversold. Neither level guarantees a reversal. When in a nice trend the RSI can remain high or low for an extended period.
For this reason, traders should rely on momentum indicators as well as price structure and market context.
InvestingCube’s recent Brent crude oil technical outlook, published on October 21, 2026, examines resistance, moving averages and momentum when assessing potential price scenarios.
Building a bullish and bearish scenario
If a technical chart justifies a specific trading plan, then it is all the more effective.
First bullish scenario: If the price closes successfully above resistance, and is that a shorter moving average keeps growing. Before opening a long position, a trader may wait for retest. That said, an area of resistance could be ascertained to gauge the upside in risk, and a stop-loss can help define when the setup has failed.
Bearish scenario: If the price continues to reject resistance and then breaks below supported, bears are in control. After confirmation a short setup could be evaluated by a trader if the ratio risk reward favors the open.
, it can make much more sense to wait before taking a clearer move, than forcing trade.
Market conditions matter, too. Technical indicators struggle to price in sharp moves due to interest-rate expectations, inflation releases, geopolitical developments and corporate earnings.
InvestingCube’s gold technical outlook, published in October 2026, illustrates how support, resistance and economic event risk can shape alternative market scenarios.
Risk Management: The Heart of CFD Trading
CFDs enable traders to speculate on price movements, both upwards and downwards, however this leverage magnifies both potential gains as well as losses. Thus, even a small adverse move in the market can lead to a large loss compared to the margin placed.
Use a dedicated invalidation level before entering initial position size after taking spreads, overnight financing charges and expected slippage into account. Do not stake what you cannot afford to lose.
Primarily, note that the above chart is notional. The way the price is moving and its indicators do not indicate a current live trading opportunity.
Closure:
A great technique for CFD technical analysis leverages price action, assistance and resistance, moving averages, momentum (and discipline). There is no indicator that wins you money. Goals: Decisions based on defined scenarios rather than predictions