



- RSI measures momentum, not direction. The RSI indicator tracks the speed of recent price moves on a 0 to 100 scale. Readings above 70 or below 30 flag stretched conditions.
- Divergence is where the real edge sits. When price makes a new high or low that RSI fails to confirm, momentum is often weakening.
- Stochastic and RSI do different jobs. Stochastic compares the close to its recent range and reacts faster, which suits sideways markets and short term timing. RSI is smoother and better in trends, and many traders combine the two while keeping risk management firm.
Momentum indicators are some of the most widely used tools in trading, and two of them show up on almost every chart platform in the world: the Relative Strength Index and the Stochastic Oscillator. Both help you judge whether a move has real strength behind it or is running out of steam. This guide walks through how each one works, how to read their signals, and how to decide which one suits your style.
What Is the RSI Indicator and How Does It Work?
The Relative Strength Index, usually shortened to RSI, is a momentum oscillator created by J. Welles Wilder and introduced in 1978. The RSI indicator measures how quickly and how far price has moved recently, then compresses that information into a single line that moves between 0 and 100. It sits in its own panel beneath your price chart.
By default, RSI looks back over 14 periods. It compares the average gains on up candles with the average losses on down candles. When gains dominate, the line climbs. When losses dominate, it drops. Readings above 70 are traditionally seen as overbought, while readings below 30 are seen as oversold. The 50 level often works as a rough dividing line between bullish and bearish momentum.
One point is worth remembering from the start. RSI does not predict anything. It describes the current balance between buying and selling pressure. A strong market can stay overbought for a long time, so a high reading on its own is not a reason to sell.
How to Read and Trade RSI Signals
The simplest approach is to watch the 70 and 30 levels. When RSI rises above 70 and then falls back under it, momentum may be fading. When it dips below 30 and then climbs back above it, selling pressure may be easing. The word that matters here is “back.” Waiting for the line to return inside the range filters out many early entries.
Trend context changes how you should read these levels. In a strong uptrend, RSI tends to hold between roughly 40 and 90, and dips toward 40 often act as buying zones. In a strong downtrend, the range shifts to about 10 through 60, and rallies toward 60 can offer selling opportunities. Using 70 and 30 in a trending market without this adjustment is one of the most common beginner mistakes.
The 50 line gives a second type of signal. A move from below 50 to above it suggests buyers are taking control, while a drop below 50 hints at the opposite. Some traders also watch for failure swings, where RSI makes a peak, pulls back, then fails to exceed that peak before breaking its recent low.
When you use the RSI indicator, remember that shorter settings such as 7 react faster but produce more false signals, while longer settings such as 21 are smoother but slower. Whatever you choose, pair it with a stop loss and a clear risk limit per trade.
READ MORE: Bollinger Bands Explained: How to Read, Trade, and Set Them Up
Divergence Trading: Spotting Reversals With RSI
Divergence is where RSI becomes more than an overbought and oversold gauge. It appears when price and the indicator tell different stories. In bearish divergence, price makes a higher high while RSI makes a lower high, a sign that the push upward is losing energy. In bullish divergence, price prints a lower low while RSI forms a higher low, suggesting sellers are tiring.
There is also hidden divergence, which points to trend continuation rather than reversal. For example, if price makes a higher low in an uptrend while RSI makes a lower low, the trend may simply be catching its breath before moving on.

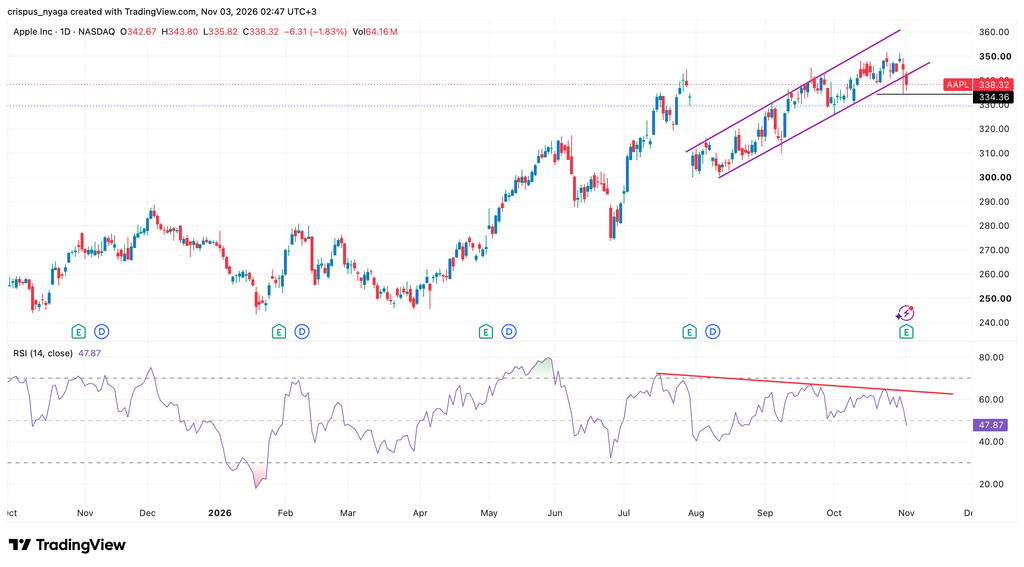
Divergence trading works best when you treat the pattern as a warning, not a trigger. Divergence can persist for several swings before price actually turns. Many traders wait for confirmation, such as a break of a nearby trendline, a candlestick reversal pattern, or a close beyond the last swing point. Higher timeframes like the four-hour and daily charts tend to give more dependable setups than very short ones. Place your stop beyond the swing that formed the divergence, so you know exactly where the idea is proven wrong.
The Stochastic Indicator Explained
The Stochastic Oscillator was developed by George Lane in the 1950s. Its logic is different from RSI. Instead of measuring the speed of price changes, it compares the latest closing price with the high to low range over a set number of periods. The idea is simple: in an uptrend, prices tend to close near the top of the range, and in a downtrend, they tend to close near the bottom.
The stochastic indicator draws two lines. The %K line is the main reading, and the %D line is a moving average of %K that acts as a signal line. A common default is 14, 3, 3. The indicator moves between 0 and 100, with 80 marking overbought territory and 20 marking oversold territory.
The typical signal is a crossover. When %K crosses above %D below the 20 level, it can point to a bullish turn. When %K crosses below %D above the 80 level, it can point to a bearish turn. Because the stochastic indicator reacts quickly, it produces plenty of signals, and not all of them are useful. Traders often filter them by trading only in the direction of the larger trend.
RSI vs. Stochastic: Which One Should You Use?
The core difference is what each tool measures. RSI tracks the strength of recent price changes, while Stochastic tracks where price is closing within its recent range. As a result, RSI is smoother and tends to hold up better in trending markets. Stochastic is more sensitive and often shines in sideways, range-bound conditions where price bounces between support and resistance.
If you prefer fewer, cleaner signals and like to analyze divergence, RSI is usually the better fit. If you trade shorter timeframes and want quick timing cues for entries within a range, Stochastic may suit you more. Neither is superior. The best choice is the one you understand deeply and can apply consistently, backed by solid risk management.
Frequently Asked Questions About RSI and Stochastic Indicators
What is the best RSI setting for day trading?
There is no single best setting, but many day traders use a period between 7 and 14. A 14 period RSI is the standard and offers a balance between speed and reliability. A shorter period reacts faster but creates more noise. Test your choice on a demo account before using real money.
Is 70 overbought and 30 oversold on the RSI?
Yes, those are the traditional thresholds. Above 70 is considered overbought, and below 30 is considered oversold. However, in strong trends the price can stay beyond these levels for extended periods, so many traders use them as alerts to watch for a reversal, not as automatic signals.
How do you trade RSI divergence?
Look for a mismatch between price and RSI at swing highs or lows. Then wait for confirmation, such as a trendline break or a reversal candle, before entering. Set your stop beyond the swing point and aim for a target that offers a better reward than the risk you are taking.
Can you use RSI and Stochastic together?
Yes, though it helps to use them for different jobs. Some traders rely on RSI to judge overall momentum and spot divergence, then use Stochastic crossovers to time the entry. Be careful not to stack too many similar indicators, because they tend to say the same thing and can create false confidence.
READ MORE: Moving Averages: SMA, EMA, and Crossovers