


- RKLB stock dropped after the company published its financial results.
- Rocket Lab published strong earnings and boosted its guidance.
- The stock has formed a head-and-shoulders pattern, pointing to more downside.
InvestingCube chart · Yahoo Finance data
RKLB stock fell more than 6% in premarket trading as investors reacted to its third-quarter earnings report. Rocket Lab dropped to $54.70, well below its year-to-date high of $151. The sell-off may continue in the near term, as the stock has formed a head-and-shoulders pattern, a common bearish reversal signal in technical analysis.
Rocket Lab Published a Mixed Earnings Report
RKLB share price continued its downward trend after the company published its financial results. Its numbers showed that its revenue rose by 73% in the third quarter to over $268 million.
Most importantly, this revenue growth will likely continue doing well, as its revenue backlog surged by 52% to over $3.6 billion. This backlog happened as the company signed about $1 billion in contracts across its HASTE, Electron, and Neutron.
Rocket Lab believes that the company has more room for growth. The management hopes that its revenue will be between $270 million and $290 million in the fourth quarter, with its gross margin being between 34% and 36%.
READ MORE: Broadcom Stock is Soaring as Nasdaq 100 Index Jumps, But Technicals Point to a Reversal

Still, the stock dropped because of its challenges in its Neutron project, which is the next class of satellite launchers. It will have more capacity and go farther than Electron, and will compete with SpaceX’s Falcon 9.
Despite the challenges, analysts remain bullish on Rocket Lab. Needham has a buy rating on the stock and a target of $120, while Citigroup has a market-outperform rating. Other analysts who are bullish on the stock are from Citizens, KeyCorp, and TD Cowen.
One of the bullish aspects is that the company is acquiring Iridium in a $8 billion deal. Its buyout will help it become a more vertically integrated company. Iridium’s revenue in the trailing twelve months (TTM) stood at $903 million, with its net income being $163 million.
RKLB Stock Technical Analysis
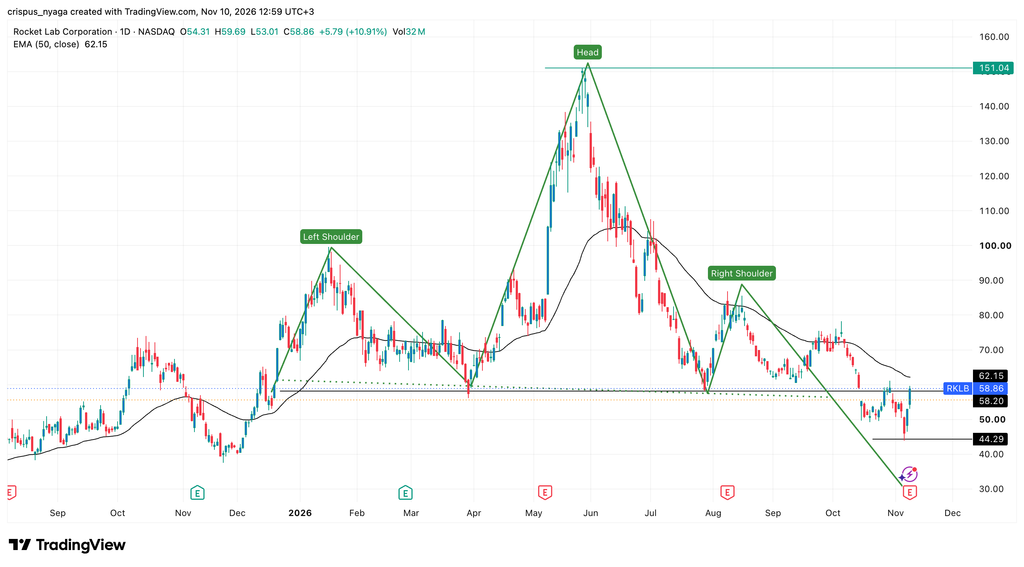
Rocket Lab stock chart | Source: TradingView
The daily chart shows that the RKLB stock has remained in a bear market, moving from a high of $151 in May this year to the current $58.86. A closer look shows that the stock has formed a multi-month head-and-shoulders pattern, which is a common bearish reversal sign.
Rocket Lab stock remains below the 50-day and 100-day Exponential Moving Averages (EMA) and the Supertrend indicator. It has retested the neckline of this pattern. Therefore, the stock will likely continue falling, potentially to the important support level of $44.30, its lowest level this month.
READ MORE: Nvidia Stock’s Trouble Pile Up With A Breach of $180 Support, But Elections Impact Overplayed
What is your outlook on Rocket Lab?
Anonymous · no sign-up · results from the last 30 days · not investment advice