


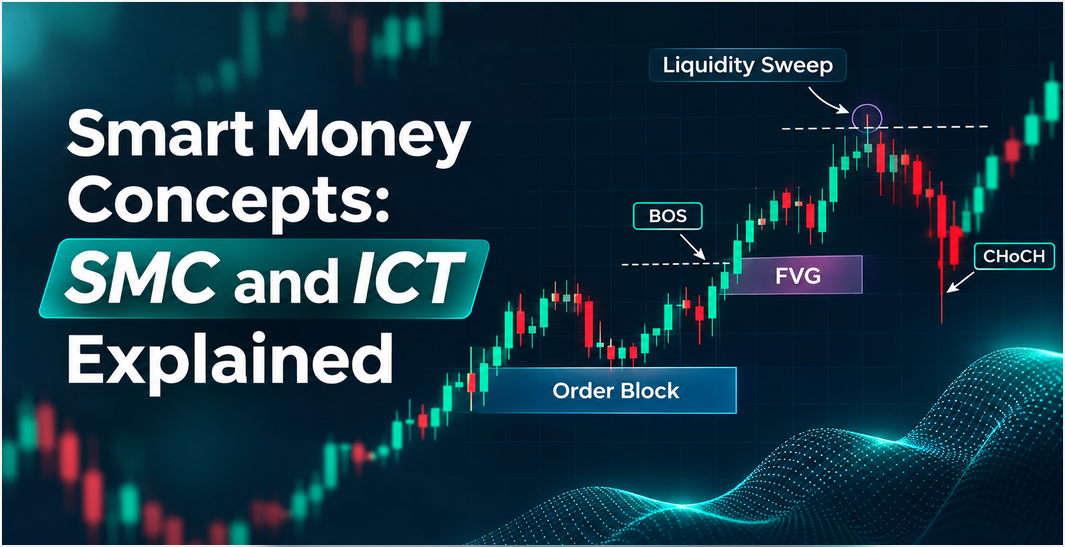
Modern technical analysis has shifted beyond traditional retail indicators like RSI and moving averages. Today, institutional order flow analysis, popularized through Smart Money Concepts (SMC) and Inner Circle Trader (ICT) methodologies, dominates advanced price action trading.
This guide breaks down what is SMC in trading, what is ICT in trading, and how to apply core price action elements like Order Blocks and Fair Value Gaps (FVG) to build a structured trading system.
What Is ICT in Trading?
ICT stands for Inner Circle Trader, a trading methodology developed by trader Michael J. Huddleston.
When asking what is ICT in trading, it refers to an institutional price action framework built around the premise that financial markets are driven by central bank algorithms and large institutional market makers rather than random retail buying and selling.
The ICT methodology focuses on identifying how institutional algorithms draw price toward areas of liquidity (resting stop losses) and inefficiency (unbalanced price movements) during specific operational time windows known as “Kill Zones.”
How does ICT trading work?
ICT traders typically analyse three elements: market structure, liquidity and price displacement. Market structure refers to the sequence of highs and lows formed by price movements. An uptrend generally consists of higher highs and higher lows, while a downtrend is characterised by lower highs and lower lows.
Liquidity refers to the availability of orders that can be executed in the market. In ICT terminology, traders often use the word to describe areas where stop-loss and breakout orders are believed to be concentrated. Displacement describes a relatively strong, rapid price movement that may indicate a change in short-term market conditions.
Consider a currency pair trading just below a previous daily high. Price briefly moves above that high, triggering some buy-stop orders and breakout entries, before falling sharply. An ICT trader may interpret this movement as a buy-side liquidity sweep followed by bearish displacement. However, the pattern does not prove that institutional traders intentionally pushed the market higher to trigger those orders.
Understanding liquidity sweeps in ICT
Liquidity sweeps are among the most frequently discussed concepts in ICT trading. A liquidity sweep occurs, in this framework, when price briefly moves beyond an identifiable high or low before reversing.
For example, suppose EUR/USD has repeatedly failed to break above 1.1050. Traders may identify this level as resistance, with buy-stop orders potentially resting above it.
If the pair rises to 1.1060 before reversing below 1.1050, ICT traders may describe the move as a liquidity sweep.
The reversal becomes more meaningful within the methodology if it is followed by strong bearish price movement and a break of a recent swing low. Nevertheless, not every break above resistance is a liquidity sweep. Some breakouts continue into sustained trends.
What Is SMC?
SMC stands for Smart Money Concepts. It is an popularized, simplified derivative of ICT trading principles used across global financial markets.
When exploring what is SMC in trading, it refers to a market analysis framework that tracks institutional capital (“smart money”, such as hedge funds, commercial banks, and central institutions) to align retail trades with institutional order flow. Rather than relying on lagging indicators, SMC traders read raw candlestick charts to identify structural shifts, institutional accumulation zones, and liquidity sweeps.
Market structure in SMC trading
Market structure is one of the foundations of Smart Money Concepts. Traders use swing highs and swing lows to assess whether buyers or sellers appear to control the market.
- In a bullish market, price typically forms higher highs and higher lows.
- In a bearish market, price typically forms lower highs and lower lows.
Two frequently used SMC terms are Break of Structure (BOS) and Change of Character (CHoCH). Break of Structure (BOS) generally describes a price movement beyond a previous significant swing point in the direction of the prevailing trend.
For example, when an uptrend produces another higher high, traders may classify the movement as a bullish BOS.
Change of Character (CHoCH) refers to a potential shift in market behaviour, often identified when price breaks an important swing level against the previous trend.
For instance, a stock that has consistently formed higher highs and higher lows may signal a possible bearish change of character when it breaks below a significant higher low.
A CHoCH does not guarantee a trend reversal. Price may recover and resume its original direction, particularly during volatile trading conditions.
Core Comparison: SMC vs. ICT
| Feature | ICT (Inner Circle Trader) | SMC (Smart Money Concepts) |
| Origin | Created directly by Michael J. Huddleston | Community-adapted version of ICT concepts |
| Terminology | Extensive (Judas Swing, Silver Bullet, Liquidity Void) | Streamlined (BOS, CHoCH, Order Block, FVG) |
| Time Dependence | Strict reliance on specific session times (Kill Zones) | Focuses primarily on market structure and price levels |
| Complexity | High learning curve with deep algorithmic theory | Moderate learning curve focused on practical chart setups |
What Is an Order Block?
When asking what is an order block in trading, it refers to a specific candle or cluster of candles where institutional participants placed large volumes of buy or sell orders prior to a strong directional market expansion. Institutions cannot execute millions of units instantaneously without driving up their entry costs. Instead, they accumulate positions within a tight range.
In many versions of the methodology, a bullish order block is identified around the last bearish candle before a strong upward move, while a bearish order block is identified around the last bullish candle before a strong downward move. The underlying theory is that these zones may represent areas where large market participants previously accumulated or distributed positions.
However, an order block visible on a chart is not proof that an institution placed a large order at that price.
Types of Order Blocks
- Bullish Order Block: The last down-close (bearish) candle immediately preceding a strong upward price movement that breaks market structure to the upside. Traders look to buy when price returns to retest this zone.
- Bearish Order Block: The last up-close (bullish) candle immediately preceding an aggressive downward move that breaks market structure to the downside. Traders look to short when price rallies back into this block.
What Is an FVG?
When asking what is FVG in trading, it stands for Fair Value Gap—a three-candle pattern that represents a 1-sided price imbalance where aggressive buying or selling caused price to move too rapidly for bidirectional trading to occur.
Identifying a Fair Value Gap
A Fair Value Gap is identified by looking across three consecutive price candles ($C1$, $C2$, $C3$):
- Bullish FVG: Occurs during a rapid upward surge. There is a visible empty gap between the high of Candle 1 and the low of Candle 3, with Candle 2 being a long green impulse candle.
- Bearish FVG: Occurs during an aggressive decline. There is a visible gap between the low of Candle 1 and the high of Candle 3, with Candle 2 being a long red impulse candle.
Because markets naturally seek balance, price frequently retraces into these FVGs to fill the inefficiency before continuing in the direction of the institutional trend.
Why do traders watch fair value gaps?
FVGs provide clearly identifiable price zones that can be incorporated into a trading plan. Traders commonly use them to identify possible retracement entries, areas of interest after strong price displacement and potential points for trade invalidation.
However, FVGs should not be confused with actual gaps in exchange trading where no transactions occurred.
An FVG on a candlestick chart can exist even when trades took place throughout the highlighted price range. It reflects the relationship between three candles, not necessarily an absence of executed transactions. This distinction is particularly important in liquid forex and futures markets.

How to Combine SMC and ICT Concepts in a Trading Strategy
SMC and ICT concepts can be combined into a structured price-action strategy by analysing market direction, identifying potential liquidity areas and waiting for confirmation before entering a trade.
The following example demonstrates how traders might use these concepts together. It is an illustrative setup rather than a proven trading system.
Step 1: Identify the broader market structure
Begin by analysing the higher-timeframe chart to determine whether the market is trending upward, trending downward or consolidating.
For example, a trader analysing EUR/USD might use the one-hour chart to identify a series of higher highs and higher lows.
This establishes a bullish directional bias, although it does not guarantee that the trend will continue.
Step 2: Mark potential liquidity areas
Next, identify previous swing highs and lows, equal highs or lows, and significant session levels.
Suppose EUR/USD is trading at 1.1020, with a previous swing low at 1.1000.
The trader may identify the area below 1.1000 as a potential sell-side liquidity zone because stop-loss orders from long positions could be concentrated there.
These orders are inferred, not directly verified.
Step 3: Wait for a liquidity sweep and market structure shift
Assume EUR/USD declines to 1.0990, moving below the previous swing low, before recovering above 1.1000.
The trader interprets this as a possible sell-side liquidity sweep.
Price then rallies strongly and breaks above a recent short-term swing high at 1.1015.
Within the SMC framework, this could indicate a bullish change of character.
The trader now has two supporting observations: a possible liquidity sweep and a bullish structural shift.
Step 4: Identify an order block or fair value gap
Following the bullish move, the trader identifies a fair value gap between 1.1005 and 1.1010.
A bullish order block may also be present near the beginning of the rally.
Rather than immediately buying after the price surge, the trader waits for a retracement towards the identified zone.
If price returns to the FVG and begins showing renewed buying pressure, the trader may consider entering a long position.
Step 5: Define entry, stop-loss and profit target
Before entering a trade, traders should determine their entry price, stop-loss level and profit target. The entry price identifies where the position will be opened, while the stop-loss limits potential losses if the market moves against the trade.
The profit target establishes where the trader intends to exit if the price moves favourably. These levels should be based on market structure and the trader’s risk tolerance, ensuring the potential reward justifies the risk taken.
Step 6: Manage the trade and review the outcome
Once the trade is active, the trader monitors price action around the entry zone and nearby structural levels.
If price breaks below the stop-loss, the planned loss is taken, subject to actual execution conditions.
If price moves towards the profit target, the trader follows the predetermined exit rules rather than changing the strategy based on emotion.
After the trade, the trader records the setup, entry, exit, market conditions and result.
Reviewing a sufficiently large sample of trades can help determine whether the strategy has a repeatable advantage.
Final Thoughts: Are SMC and ICT Worth Learning?
Smart Money Concepts and ICT provide traders with a structured way to analyse price action through market structure, liquidity, order blocks and fair value gaps. Their main appeal lies in helping traders develop specific observations about where price may react and what conditions could support a trading decision.
However, traders should distinguish between the explanations offered by these methodologies and what can actually be verified from market data. A liquidity sweep does not prove institutional manipulation, an order block does not confirm the presence of unfilled institutional orders, and a fair value gap does not guarantee that price will return to a particular level.
For traders interested in SMC and ICT, the most useful approach is to establish objective trading rules, test them across different market conditions and maintain disciplined risk management.
SMC trading can produce profitable trades, but there is no reliable evidence that Smart Money Concepts as a broad methodology consistently outperform other trading approaches. Profitability depends on the specific rules used, trading costs, risk management and the trader’s ability to execute the strategy. Historical chart examples alone are insufficient to demonstrate a profitable trading edge.
ICT is a specific trading methodology developed and taught by Michael J. Huddleston, while SMC is a broader term covering price-action techniques associated with liquidity, market structure and institutional trading behaviour. The two approaches share many concepts, including order blocks, fair value gaps and liquidity sweeps. However, ICT also includes more specific terminology and models relating to trading sessions, timing and price delivery.
Yes. Beginners can learn Smart Money Concepts, although it is helpful to first understand candlestick charts, support and resistance, market structure, order types and basic risk management. Traders should practise identifying setups on historical charts and demo accounts before risking real money.
No. Order blocks and fair value gaps do not guarantee that prices will reverse or continue in a particular direction. Markets can move through these zones without reacting, especially during major economic announcements or periods of strong directional momentum. Traders should evaluate these patterns alongside broader market conditions and predefined risk management rules.