



- Private equity is investing in unlisted companies. Funds buy, improve, and sell them.
- Access depends on your status and location (US, UK, India, and Middle East).
- It has unique fees, risks, and returns. It is for education only.
Fundamental analysis is used to determine a stock’s actual value based on the business operations of the company, the company’s financial statements and the economic conditions in which the company operates. It answers just one basic question. Does this stock represent a better value at today’s price or a worse value at today’s price? This guide describes fundamental analysis in plain language. You will find out how to perform fundamental analysis of stocks using a step-by-step method. You will discover which ratios are important and how to interpret an annual report. This information is meant to educate you, not advise you.
What Is Fundamental Analysis and How Does It Work?
If you were going to buy a home, you wouldn’t be willing to pay the listing price until after you had inspected the home’s square footage, physical condition, and location. Fundamental analysis does essentially the same thing with a stock. In fundamental analysis, you evaluate both the earnings and assets of a company.
Price and value are different things. An expensive stock may be overpriced. An inexpensive stock may be cheap. Fundamental analysis will help you to pay less for stocks. It will also help you to keep holding your stocks as long as they are good ones, because you understand why you bought them.
This work is divided into two sections. One section is quantitative in nature, using financial metrics such as revenue, profits, debt and cash flow to assess the company’s performance. The second section is qualitative in nature, which involves making judgments about the company based upon its business model, competitive advantages, management quality and the industry it operates in. To make an assessment of the company you will need to utilize both types of analyses.
Be truthful regarding what you cannot do. Fundamental analysis will not provide you with information regarding how stock prices may move in the near future. Additionally, valuations are dependent upon assumptions. Therefore, it is possible for two analysts to analyse the same company and arrive at varying valuations. Always consider each valuation as a range of values rather than a single valuation.
How to Do Fundamental Analysis of Stocks: A Step-by-Step Process
Here is a simple process you can follow.
Step 1: understand the way your firm earns profits. Then, Step 2: assess the industry and the economy (i.e., interest rate trends, economic growth). Next, Step 3: review the financial reports. Step 4: calculate the financial ratios. Later, Step 5: determine an estimated value based upon several valuation methods. Step 6: evaluate the estimated value against the current market price and provide a “margin of safety.”
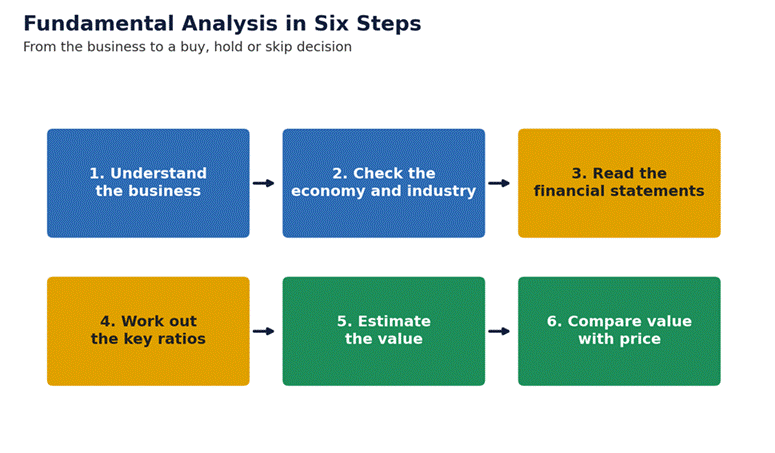
Image 1: Flowchart with six steps: Understanding the business, checking the economy/industry, reading financial statements, working out key ratios, estimating value, and comparing value to price.
Do understand
First, the company, Example Co., sells software to smaller businesses and has loyal customers. Second, the industry is in a position where demand for the software sold by Example Co. is growing. Third, the financials of Example Co.: Revenue increased from $450 million to $500 million, resulting in 11.1% growth. Net Profit for Example Co. was $60 million, resulting in a 12% margin. Example Co. had $150 million of debt compared to $300 million of equity, making the debt-to-equity ratio for Example Co. 0.5. At the time of this analysis, the share price for Example Co. was $48 and earnings per share were $2.40, resulting in a P/E ratio for Example Co. of 20.
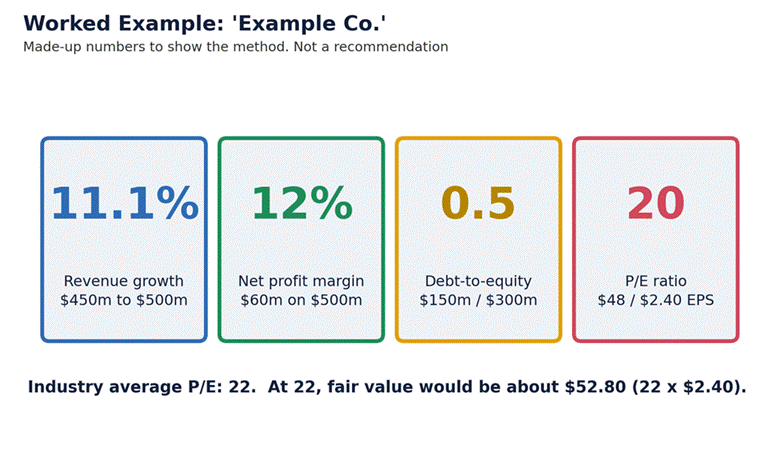
Image 2: There are four different squares displaying the various financial metrics for Example Co.; specifically, revenue growth at 11.1%, net profit margin at 12%, debt to equity ratio at.50, and Price Earnings ratio (P/E) at 20. Additionally, there is a line below these squares that states the average P/E for the industry is 22 and that the stock has an estimated fair value of $52.80.
The estimated price per share based on the average price-to-earnings (P/E) ratio of similar companies would be approximately $52.80 ($2.40 x 22). This estimate is higher than the current market price of $48. Note that this is an illustration only and should not be considered as a buy/sell signal.
Note the difference between $48 and $52.80. Conservative investors like to have an extra amount (margin of safety) of money in case they are wrong with their projections. Ten percent of the total value is a small margin. Many investors would prefer to see a larger margin.
Key Financial Statements and Ratios to Analyse
Three separate statements explain the company’s financial history. You should learn to interpret a balance sheet, an income statement, and a cash flow statement. A balance sheet will provide information about the company’s assets (ownership) and liabilities (debt). An income statement provides insight into the company’s profitability. A cash flow statement indicates the amount of actual money that is currently available to the company. The SEC beginners’ guide explains all three.
The number of employees is only one part of the task. Inquire about the “moat,” or what provides protection for the company against competitors. This can be accomplished through a variety of means such as establishing a strong brand name, having patents, or maintaining a cost advantage. Determine if the executives of the organization hold equity in the business and if they have historically performed well. Inquire if the industry is expanding or declining. Make brief comments on each area. A ratio cannot provide the context that judgment can.
The list of common financial ratios provided above. What is considered “good” will vary based upon the specific industry. When comparing a company’s performance, compare it against other companies within the same industry as opposed to the overall market.
| Ratio | What it measures | Rough rule of thumb |
| P/E ratio | Price compared with earnings | 15 to 25 is common for steady firms |
| Price-to-book | Price compared with net assets | Under 1 may mean cheap; banks often 1 to 2 |
| Debt-to-equity | Debt compared with owners’ money | Under 1 is often comfortable |
| Net profit margin | Profit per dollar of sales | Above 10% is usually healthy |
| Return on equity | Profit made on owners’ money | 15% or more is strong |
| Free cash flow | Cash left after spending on the business | Positive and growing |
Look at trends, not one year. A P/E of 20 means little alone. Is it rising or falling? Compare five years of margins. A company with steady margins and falling debt is often healthier than one with a single great year.
Stock Valuation Methods: P/E, DCF, and Price-to-Book
Stock valuation methods turn numbers into a value. The first is the P/E ratio. You multiply earnings per share by a fair P/E, as we did above. It is quick, but it depends on picking the right peers.
The second is discounted cash flow, or DCF. You forecast future cash flows. Then you shrink them back to today’s money using a discount rate. The value that is inherent within an asset can be determined using a discounted cash flow (DCF). While DCF is a very strong tool to use, even minor adjustments to either the growth rate or the discount rate will cause the outcome to change significantly.
A basic DCF consists of three parts. First, you need to project your cash flow over the next 5 to 10 years. Second, select a discount rate (usually between 8% and 10%). Third, determine the present value of the remaining years beyond your projection period.
The last one is price to book. This compares the cost of the stock to the net value of each share. It works well with financial institutions (banks) and other companies with large numbers of assets. On the other hand, it’s not as good at evaluating software companies because their worth lies in ideas and people.

Verify if multiple methods agree on an estimate. If one method provides an estimate of $53 for P/E, and another method provides an estimate of $35 for DCF, then determine why. It may be due to assuming more growth than was actually present. This difference is what teaches you about your assumptions.
Annual Report Analysis: What to Read and What to Look For
Annual report analysis can feel heavy, so read in a smart order. Find the report on the SEC EDGAR database or the company’s investor page. Start with the management discussion. It explains results in plain words. First, read the risk factors. Next, read the notes to the accounts, which contain the detailed information. Finally, read the auditor’s report.
Review the debt footnotes to see when loans will come due and what the current interest rates are. A company with a large amount of debt coming due within the next year and limited cash could quickly find itself in trouble.
Be aware of potential “red flags.” If sales increase while cash flow decreases, this should be considered a warning. Additionally, if receivables grow at a faster rate than revenue, if there are multiple large one-time gains, or if there have been numerous changes made to the accounting policies, these may also be indicators. A serious warning from the auditor regarding the continued operation of the business is a strong indication. Lastly, increasing debt accompanied by decreasing profits is also an indicator that the company could be facing difficulties.
Check the segment data as well. That will tell you what areas of the business are on the rise. If there is a five-year summary, read it. Pay attention to how management addresses errors. Honest reporting admits errors.
Fundamental Analysis vs. Technical Analysis: When to Use Each
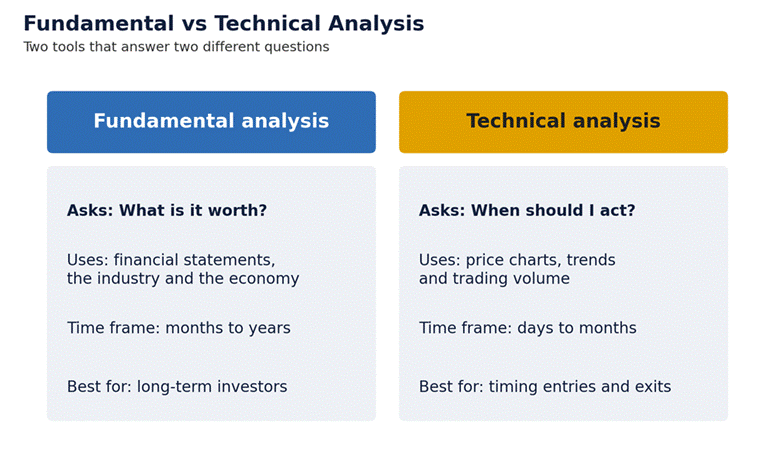
Image 3: Two side-by-side panels. Fundamental analysis asks what a stock is worth, uses financial statements and the economy, looks at months to years, and suits long-term investors. Technical analysis asks when to act, uses price charts and volume, looks at days to months, and suits timing.
The two tools answer different questions. Fundamental analysis asks what a stock is worth. Technical analysis asks when to act. Many investors use fundamentals to pick a stock and charts to pick an entry. Our guide on how to pick stocks shows how to combine them.
Fundamentals indicate which stocks you should purchase. Charts assist you with determining when you should make that purchase. For example, if you find Example Co. to be appealing at $48, you could potentially wait until the stock’s price remains above a support level prior to making the purchase. Waiting may lessen the possibility of regret; however, it will not eliminate risk.
Frequently Asked Questions About Fundamental Analysis
What is fundamental analysis in simple terms?
This process involves evaluating the actual worth of a firm based upon their operations, financials and the current state of the economy. After doing so, you can then evaluate whether the stock market price reflects the true value of the firm.
What are the most important ratios in fundamental analysis?
P/E, Debt-to-Equity, Net Profit Margin, Return on Equity, and Free Cash Flow are an excellent starting point. Make sure to compare these ratios against other companies that operate in the same industry.
Is fundamental analysis better than technical analysis?
Both methods have their own advantages. Long-term investment strategies are best suited for fundamental analysis, while technical analysis can help investors time the market. Most investors combine these two approaches when making investment decisions.
How long does fundamental analysis take?
A short review could be as long as an hour. A complete analysis of a single organization may last several days. However, as you gain experience with this process, it will become easier and quicker for you to complete these tasks.
Can beginners do fundamental analysis?
Yes. First find a company you are familiar with and get some of the ratios for that company. You can find free reports on the internet. Take your time, write down what you learn as you go along. Practice analysing each company separately until you feel comfortable enough to invest in one.