



- GBP/USD trades near 1.3420 after the BoE hike.
- Key levels: 1.3500 above, 1.3340 below.
- Next tests: UK GDP and the December Fed.
InvestingCube chart · Yahoo Finance data
Sterling Finds Its Footing
The British Pound (Sterling) has had an incredibly difficult year; however, things are looking up. On November 5th, the Bank of England increased interest rates by one-quarter of a percent, to four percent. This is the first-rate increase for the Bank of England since August 2023. Currently, the GBP/USD exchange rate is trading at approximately 1.3420. This is significantly higher than the low point that occurred in October of this year, which was 1.3140.
The Bank of England shows the vote was 8 to 1. So, what does the chart say?
Reading the GBP/USD Chart
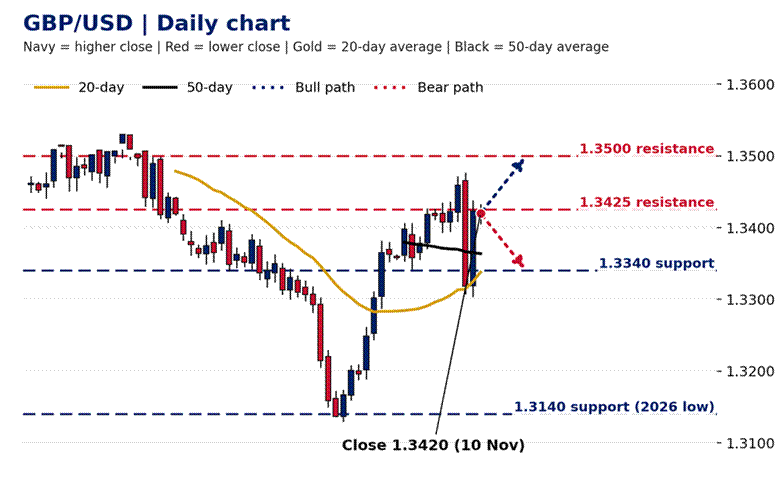
Start with the colours. Navy candles are days the pound closed higher. Red candles are days it closed lower. The gold line is the 20-day moving average. The black line is the 50-day average. The red dashed lines show where there may be resistance around 1.3500 and 1.3425. The blue dashed lines show where there may be support near 1.3340 and 1.3140. Let’s examine the shape. Price dropped sharply to 1.3140 in mid-October. After that drop, price bounced and moved above both moving averages. This indicates that buyers were able to return to action. However, the right side of the chart shows problems. Price has been unable to climb above 1.3500. We saw a similar false start in our note on a possible bull trap. The dotted arrows show two paths. One heads up to 1.3500. The other heads back to 1.3340.
Why These Levels Matter
Two central banks now sit at the same rate. The BoE and the Federal Reserve are both at 4%. Deutsche Bank had called the BoE hike “widely expected”. Markets now price another UK hike by February. They also price a Fed hike in December after hot US inflation. That tug of war explains why 1.3500 is hard to break. Our piece on the Fed hike and the softer dollar shows why rate gaps drive this pair.
Three Scenarios

- A close above 1.3500 could lead to the 2026 high at 1.3867. A soft US report could assist this process.
- Bearish: A close below 1.3340 will put 1.3140 back into consideration. An unusually high U.S. report may help make that happen.
- In addition, the level of uncertainty is expected to be somewhere in-between these two extremes. The short-term forecast will most likely be correct. However, in terms of the long-term, experts anticipate that the rate of exchange should fall within the range of 1.32 to 1.37 by the end of the year.
How You Could Trade It
Keep things as simple as possible. Wait until the end of the day to make your decision, don’t base your entry on a rapid rise in prices. Place your stop-loss order at a point slightly above/below the price you’re tracking. Use a tiny part of your overall trading capital, normally less than 1%. It’s better to enter a trade based on a clear breakout followed by continued price action than guessing where the highest price will be.
What to Watch Next
UK third-quarter GDP lands on 12 November. The Office for National Statistics publishes it. US jobs data and the 9 December Fed meeting follow. The pound also found support when the dollar slipped, as we noted in the pound on solid foundations. Keep position sizes small on data days.
So, can the pound finally clear 1.3500? Or will the next Fed hike win again? Check the levels before UK GDP, then tell us what you think.
Frequently Asked Questions
Why is GBP/USD stuck below 1.3500?
The Bank of England and the Federal Reserve both sit at 4%, and markets expect more hikes from both. That tug of war keeps the pair in a range. Sellers have defended 1.3500 several times.
What is the key GBP/USD support levels?
Support sits at 1.3340, the bottom of the recent range, then 1.3140, the 2026 low from mid-October.
What could push GBP/USD higher?
A close above 1.3500, softer US data or a hawkish Bank of England message would help the pound. Strong UK GDP on 12 November could add to that. This is general information, not advice.
What is your outlook on GBP/USD?
Anonymous · no sign-up · results from the last 30 days · not investment advice