


- USD/SEK jumped 1% to about 9.97.
- Resistance 10.00; support 9.8534.
- Watch US inflation and the Riksbank.
InvestingCube chart · Yahoo Finance data
Sweden’s central bank is now part of the “hiking club.” The Riksbank increased its policy rate by 50 basis points (to 2 percent) on November 4, which is the first time in over three years that they have done so. However, on Thursday the Swedish Krona weakened against the U.S. Dollar. A stronger-than-expected inflation report in the United States caused the Dollar to rally. As a result, USD/SEK rose 1%. Now let’s look at the chart.
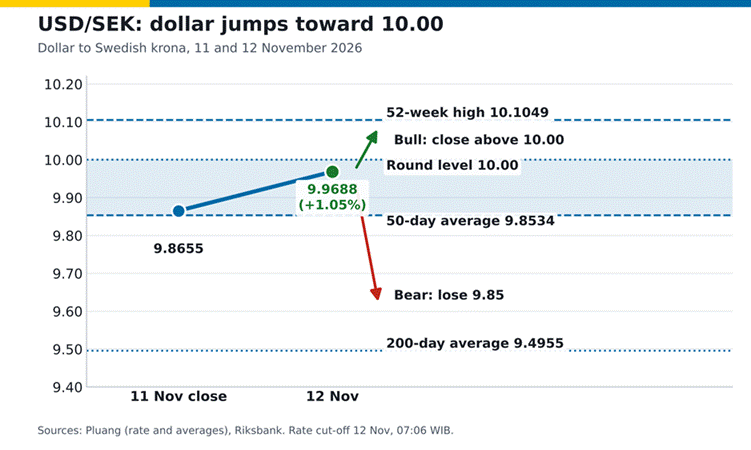
Figure 2: USD/SEK key levels in Sweden’s blue and yellow. Data as of 12 November 2026.
What the Chart Shows
The blue line has two points. USD/SEK was 9.8655 at its close on November 11th. It hit around 9.9688 on Nov. 12. That is a gain of 1.05%. The green dot denotes the most recent price. Keep your eyes on the blue band between 9.85 and 10.00 The 50-day average, or its floor, is at 9.8534. Its upper limit is the round number, 10.00. 54-week high at 10.1049 lies above it. At the bottom are the 200-day average at 9.4955 Price sits above both averages. That being dollar in a stronger position an increase on this pair indicates a stronger dollar and therefore a necessarily weaker krona. The bull path is evinced by the green arrow.
. The red arrow shows the bear path. Another dollar pair is in our GBP/USD technical analysis.
The Riksbank Story
The Riksbank said it will raise rates further in the coming year. Inflation is the reason. CPIF was 1.5% in September, but energy costs are rising. ING expects another hike in February, it wrote before the meeting. ING also noted the krona is still about 4% weaker this year. It sees few hikes after February, though it says risks lean hawkish. The new rate took effect on 11 November. The Bank also said inflation should keep rising. That is a clear signal for the krona.
The krona is not alone. Central European currencies are moving too. Our EUR/PLN report looks at the zloty’s slide.
Why the Dollar Is Strong
US inflation beat forecasts. The Bureau of Labor Statistics publishes the figures. Traders now see a December Fed hike as likely. That pushes yields and the dollar up. Higher US yields make the dollar more attractive. Money flows to where returns are higher. The Fed meets again in December. That date is the next big test. Watch it closely. Our USD/BRL forecast shows the same dollar strength against the Brazilian real.

Sweden has data too. Statistics Sweden, known as SCB, publishes inflation. A jump in core inflation would back more Riksbank hikes. Check both reports before you trade. Oil and bond yields matter as well. See our gold price forecast for the wider picture.
Three Scenarios
- Bullish: a close above 10.00 targets the 10.1049 high.
- Bearish: a close below 9.8534 opens a drop toward 9.50.
- Neutral: a range between 9.85 and 10.00.
The short-term pace of the market is set by U.S. data and Federal Reserve comments. Over the long term, as the Riksbank continues to increase its interest rates, the Swedish Krona should appreciate. On the other hand, the Federal Reserve could also raise rates. There are some periods where liquidity in Krona pairs is low. After significant economic reports are released, spread sizes tend to grow. Therefore, before the data is published, have an idea of what type of trade you want to enter into. Make sure that your risk remains relatively small. It is essential to use a stop-loss order each time you open a position. If 10.00 is broken, where will you place your stop-loss order?
Frequently Asked Questions
Why did USD/SEK rise on 12 November?
The recent hot US inflation report increased the likelihood that there will be a Fed hike in December. This caused the dollar to rise against the krona.
What is the key USD/SEK resistance?
10.00 is the round number. The 52-week high of 10.1049 is the next ceiling.
Where is USD/SEK support?
The 50-day average at 9.8534 is the first support. The 200-day average at 9.4955 is far below.
What is your outlook on USD/SEK?
Anonymous · no sign-up · results from the last 30 days · not investment advice