



- AUD/INR sits near 64.18.
- Resistance 64.46 to 64.93; support 63.71.
- Watch US inflation and the rupee.
InvestingCube chart · market data
It’s been a bit of an up-and-down two weeks for the Aussie. The Reserve Bank of Australia raised its cash rate to 4.85 percent on November 3. Six of nine members of the RBA voted in favour of the raise. However, despite this move, the Australian dollar continued to lose ground against most major currencies. In contrast, the Indian rupee began to find support. Where will the AUD/INR pair head now? The chart above provides some clues.
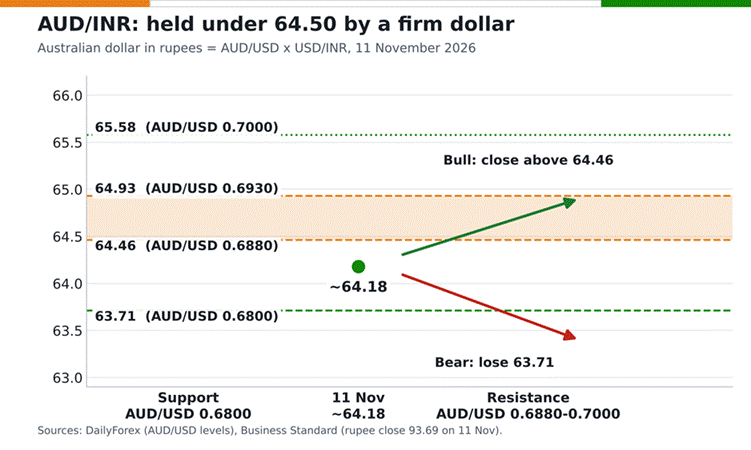
Figure 1: AUD/INR key levels in saffron and green. Data as of 11 November 2026.
How to Read the Chart
AUD/INR is a “cross,” meaning that you can calculate it by multiplying the AUD/USD exchange rate by the USD/INR exchange rate. On November 11th, the Australian dollar (AUD) was trading around 0.6850 relative to the U.S. dollar (USD). At the same time, the Indian rupee (INR) was closing at 93.69. Therefore, on this date, the AUD/INR cross rate was approximately 64.18. This is represented by the green dot in the center of the chart. Now let’s examine the bands and lines on the chart. The orange band ranging from 64.46 to 64.93 represents resistance. These levels correspond with AUD/USD at 0.6880 and 0.6930, respectively. The dotted green line located at 65.58 corresponds with AUD/USD at 0.7000. This is the large round number. Finally, the green dashed line located at 63.71 represents support. This level corresponds with AUD/USD at 0.6800. The green arrow indicates a bullish direction, while the red arrow indicates a bearish direction. You should check your trading platform to see the current value of the cross. Small gaps between feeds are normal. For another commodity currency, see our USD/CAD technical analysis.
Why the Rupee Is Strong
The rupee closed at 93.69 on 11 November. That was its best close since April. Foreign investors bought nearly $6 billion of Indian stocks this month, Business Standard reports. The rupee has appreciated 1.35% in November. It remains significantly above its previous low point of 96.96 reached during May. Additionally, bond yields have increased. The 10-year yield has reached 7.21%. However, the flow of capital was the winner. When the rupee appreciates, it is generally bad for the AUD/INR currency pair as it causes the exchange rate to decline.
Oil matters here. India imports most of its crude. Cheaper oil helps the rupee. Our Dow Jones report shows how cheaper oil eased inflation worries across markets.
Why the Aussie Is Soft
The Aussie is losing its rate edge. US inflation came in hot. Traders see about an 84% chance of a Fed hike in December. AUD/USD slid under 0.6850. The 6 to 3 vote shows doubts inside the RBA. Dollar strength also hit gold, as our gold report shows. Australian inflation data from the Australian Bureau of Statistics will guide the RBA next.
India has its own data. October retail inflation was due on Thursday. It will shape what the Reserve Bank of India does next. Our India gold and silver report covers Indian demand and prices.

Three Scenarios
- Bullish: a close above 64.46 targets 64.93.
- Bearish: a close below 63.71 opens 63.00.
- Neutral: a range between 63.71 and 64.46.
Short term, US data rules. A high print will help the dollar and hurt the Aussie. Long term, the RBA’s 4.85% rate still gives the Aussie some support. However, the rupee has become stronger. This currency pair is not as popular as other major pairs. Therefore, spreads can be wider. AUD/INR changes when either the Aussie or the rupee change. Pay close attention to both currencies daily. Limit your risk. Set a stop loss. No strategy works all the time. If 63.71 breaks, where would you set your stop loss?
Frequently Asked Questions
What is AUD/INR?
It is the price of one Australian dollar in Indian rupees. You can work it out by multiplying AUD/USD by USD/INR.
What is the key AUD/INR resistance?
The 64.46 to 64.93 band is the first test. The 65.58 level is the big round number.
Where is AUD/INR support?
63.71 is the main support. Below it, 63.00 is the next round level.
What is your outlook on AUD/INR?
Anonymous · no sign-up · results from the last 30 days · not investment advice