


- Technical indicators for palladium are still in a bearish position, with the price of palladium being below significant moving averages.
- Support is clustered at 875.75, 868.25 and 854.25; the pivot is 889.75.
- A closing price above 897.25 would increase the likelihood of a continued rebound, but a decline past 875.75 will cause the possibility of further declines to remain open.
Palladium drops on both ends of the supply-demand equation. Find out where it may go next based upon important price points, trend indicators and three potential future paths.
The market is in a position where the final closing price on the daily chart could be more significant than the overall trend. Below is a graphical representation of the current price relative to technical reference levels. It is designed to assist you with making decisions and not to predict future trends.
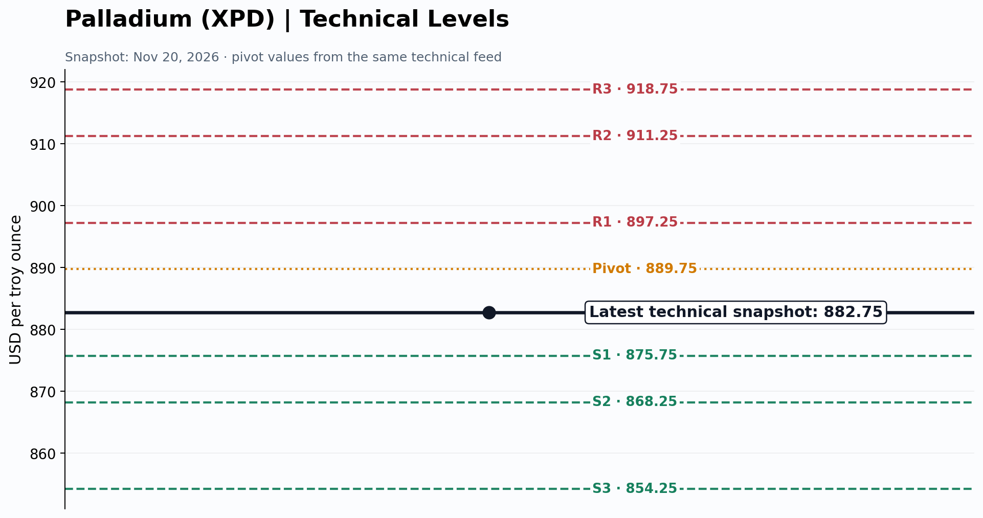
Technical level map · Latest available snapshot
Palladium’s sharp fall puts buyers on the spot
Palladium has been through a rough period. On November 20th, the most recent technical snapshot had palladium quoted around $882.75. Another market tracking service reported a session low-area print near $881. This movement is a reminder that palladium can quickly change direction. It is a smaller and less liquid market than gold. When traders need to make quick changes to their positions, prices can fluctuate sharply.
The metal is linked directly to the production of cars. Cars have catalytic converters which are made up of palladium. Gasoline powered cars are the largest users of palladium. Therefore, the amount of palladium used will depend on car manufacturers’ production schedules, their compliance with emission standards, the popularity of hybrids, and whether they can substitute one metal for another. In addition to being dependent upon car production, palladium mining is concentrated. If there is a problem at a mine, even though the demand may be weak, it could still affect the supply of palladium.
Traders are currently asking themselves if this latest downward trend is coming to an end, or just taking a breather. On the other hand, for long term investors the question is what direction the relationship among auto industry demand, recycling and mine supply will go. A low price alone is not a buy signal; both the chart and the fundamentals must indicate the same thing.
Reading the palladium chart
The chart above is a level map, not a candle-by-candle price history. It shows where the last technical picture of the day was in relation to the standard pivot and support/resistance levels that are produced daily for each trading session. The black line indicates 882.75. The green broken lines indicate support at 875.75, 868.25 and 854.25. The yellow dotted line represents the pivot point at 889.75. The red broken lines represent resistance at 897.25, 911.25 and 918.75.
Price is currently trading below the pivot level. As long as this remains true, the immediate sentiment should remain cautious. The first potential support area to be tested will be 875.75. If price can find support there then we may see a period of consolidation or perhaps even a brief rally. If price falls through that support area we will then begin looking at 868.25 and 854.25 as possible downside targets. It is important to remember that although these are potential support levels they are not necessarily turning points.
On the positive side, 889.75 is the first hurdle for the stock. If it closes above the pivot point, this will provide some stability to the chart, however, the bulls are going to have to get over 897.25. If they can continue to trade above this area, this will be much more credible than simply an intraday spike. After getting past 897.25, the next potential targets are 911.25 and 918.75.
Momentum is stretched, but oversold is not a buy signal
In addition, the current technical reading indicates a very weak momentum environment. The 14-day RSI is currently at approximately 19 and MACD is negative. Furthermore, the moving-average table indicates that prices are below their short, medium and long-term averages. All 12 average signals indicate a sell. Therefore, it is clear that there is a strong downward trend in place, as opposed to a confirmed reversal.
A relative strength index (RSI) below 30 is typically considered “oversold.” An oversold RSI indicates that there has been an extreme amount of selling recently. However, this does not indicate that prices will increase in value right away. During a strong downward trend, a reading of oversold can last for many days. Many times, traders will look for a higher low, a bullish candlestick pattern, or for the price to break through a level of resistance prior to viewing the reading as being beneficial.
The average true range was approximately 10.34 in the snapshot. This provides an estimate of daily movements; however, this does not represent a prediction. Position sizes need to take into consideration the metal’s volatility. If you place a stop-loss order too close to your entry point, there’s a risk that it will be triggered by random market fluctuations. On the other hand, if you set your stop-loss order too far from your entry point, you could potentially experience a larger loss than originally planned.
Why palladium’s fundamentals still matter
Demand for palladium will be determined by how quickly the auto industry adopts electric vehicle (EV) technology. While hybrid vehicles will continue to utilize combustion engines and therefore require palladium based catalytic converters, fully electric vehicles do not have such requirements. Therefore, the rate at which the auto industry transitions to full EV production will ultimately determine the future need for palladium.
Supply is also a component of this narrative. Most of the world’s mining output comes from a small group of producing nations, and their decisions about how much to produce are influenced by cost, investment strategies, labour relations, and energy supply. Recycling can help alleviate shortfalls in supply; however, the amount of scrap generated will be dependent upon the age of the vehicles being recycled, the collection of the scrap, and the market value of the metals. Although lower metal prices may ultimately reduce supply, there will likely be a delay in that reaction.
Palladium is currently trading with respect to Platinum. If there is a price difference between the two metals, manufacturers will have an opportunity to modify their catalyst formulations if allowed by technical and regulatory standards. Substitution takes place gradually, it will not occur in a short period of time; however, substitution can affect demand over a long period of time.
Four market forces to keep in view
First, there is the US dollar. A strong US dollar may depress dollar-priced metal prices as a result of making those metals more costly to purchasers who are buying with other currencies. In addition, movements in the US dollar can represent shifts in market expectations regarding interest rates and risk tolerance. Thus, a rapid change in the Federal Reserve’s stance can impact palladium price movements even in the absence of new industry information.

A second key indicator for copper demand is the state of vehicle manufacturing and sales. Watch closely what large automakers say about future production and how consumers are purchasing vehicles. A recovery in the production of gas-powered and hybrid vehicles could provide support to the overall demand environment for copper. However, a decline in global manufacturing could have the opposite effect on copper. Finally, pay close attention to supply-side developments. Mining closures, reductions in output, or other disruptions could result in an immediate tightening of the copper market, as the majority of the world’s copper is produced by just a handful of nations.
Fourthly, positions and liquidity. Palladium can rise dramatically as long as there is an overabundance of speculation in the market. A sharp drop may result in a short covering rally; however, if no additional purchases occur, the price will soon fall again.
The silver market coverage also provides a useful comparison across precious metals.
Readers looking at the wider metals theme may also follow InvestingCube’s gold forecast and long-term outlook, which discusses rates, the dollar and structural demand.
Three scenarios for the next move
Palladium is expected to hold 875.75 and move back above 889.75. Once this occurs, buyers will need to close above 897.25 in order for the bounce to have legs. If the bounce continues to the upside, we may see palladium head toward 911.25 and 918.75. The likelihood of this happening would increase if the dollar was to weaken and/or there was positive news about automotive demand/supply.
Bearish Case: The 875.75 support fails at the end of a trading day, not simply a quick drop. This would then put 868.25 and 854.25 into play. A failure of the bottom support band would indicate that sellers are still in charge. It is important for traders to remember that although the RSI may be oversold, this does not mean there cannot be another down move.
Neutral Case: The price will remain within the price levels of 875.75 to 897.25 as the market processes the decline from earlier. This will benefit being patient with your entries and not going after the price as soon as you see a direction. Although the range may appear small at first, as more data comes out (economic releases, supply news), the range can grow significantly. If there is a daily closing price above or below this range, then we have a stronger signal than if we were just to trade the price movements inside the range.
What this means for investors
Palladium is not a traditional safe haven, as it has been a base metal for many years and its demand sources are shifting. Long-term investors need to consider what part palladium will play in their overall investment strategy and how much downside risk they can accept if the price continues to fall. While short-term traders can concentrate on the pivot point and the nearest support level, they must also evaluate the available liquidity and contract terms prior to initiating a trade.
Do not mistake a price reduction for value. An asset that is currently lower-priced may continue to drop in price should there be a deterioration of its fundamentals. Likewise, supply risk could cause a downward-trending technical pattern to abruptly turn around. A logical way to invest is to establish a theory about an investment opportunity, determine how you would know when your theory has been disproven, and limit the amount of money you invest based upon those parameters. For a broader technical framework, see InvestingCube’s technical analysis guide.
The latest readings lean bearish, but the next few closes matter more than a single headline. Watch whether buyers defend 875.75 and whether the price can reclaim 889.75. A sustained move in either direction will tell more than a dramatic intraday wick.
Trading checklist: wait for price confirmation
Before you enter a trade, you should create a quick check list of things to consider. One: do not enter a position until after price has tested the level you want to use for support/resistance. Do not just place your order at the line simply because it is close. Two: determine how you will confirm the trade. A daily close above/below a key level and then a subsequent retest provides much stronger confirmation of a trade than a single intra-day wick. Three: decide where you want to exit your position prior to entering. By doing so, you can prevent yourself from changing your mind about when to exit a losing position.
Palladium can have large gaps (sharp movements) in thin market conditions. Whether an intended entry point was filled as planned matters. When trading via futures or CFDs, check the contract month, spread, margin requirements and trading hours. References for spot metals can differ from prices of derivatives. You need to match the chart level with the instrument you plan on trading.
When the primary reason for making the trade is no longer valid, exit the trade per the original plan. You don’t need to try to capture each of the rebounds. Your goal should be to create repeatable decision-making and preserve your capital for future opportunities.
FAQ
Is palladium oversold? The current RSI reading at approximately 19 is below the typical 30 level, which indicates significant selling pressure; however, it does not provide an indication of a bottom.
What support levels are important? The Technical Snapshot shows three classic support levels: 875.75, 868.25 and 854.25. Pay attention to how prices react when they reach each level.
What will make the outlook look better? If the market can get back to 889.75 and then close at least a day higher than 897.25, that would improve the short-term picture of the charts. However, supply news and vehicle demand data are going to continue to play a factor in this.