



- Gold price continued its downward trend, reaching its October 2025 low.
- The Federal Reserve will publish minutes of the last meeting on Wednesday.
- The XAU/USD pair has formed a double-bottom pattern.
InvestingCube chart · Yahoo Finance data
Gold price continued its downward spiral on Monday, reaching its lowest level since October last year as traders waited for the upcoming Federal Reserve minutes and statements from top officials, including Kevin Warsh. XAU/USD dropped to a low of 3,829, down by over 17% from its August highs.
Federal Reserve Minutes and Retail Sales Data
XAU/USD pair continued its downward trend as investors focused on the upcoming macro data from the United States. The Census Bureau will publish the latest retail sales numbers on Tuesday, providing insights into the state of the economy. Economists expect the upcoming report to show that sales rose 0.2% in October, a big deceleration from the previous 0.8%. Core sales, which exclude the volatile food and energy prices, are expected to come in at 0.4%, lower than the previous 0.9%.
A strong retail sales report will raise the possibility of the Federal Reserve hiking interest rates in the next meeting. Indeed, markets are already pricing in a rate hike, with the only issue being the size of the hike. Some analysts expect the bank to hike rates by 0.25%, while others see it rising by 0.50%.
READ MORE: Crypto Crash Today: Why Bitcoin and Altcoins Are Falling as Liquidations Mount

Gold will next react to statements from several Federal Reserve officials, including Kevin Warsh. This will be the first public statement since the Fed decided to leave interest rates unchanged in the last meeting.
On the positive side for gold, crude oil prices are falling ahead of the upcoming Trump, Xi Jinping, and Vladimir Putin meeting in China. Brent, the global benchmark, dropped to $95, while the West Texas Intermediate (WTI) fell to $87. The falling oil prices helped to dragging US bond yields, with the ten-year and five-year falling to 5.14% and 4.96%, respectively.
XAU/USD Technical Analysis
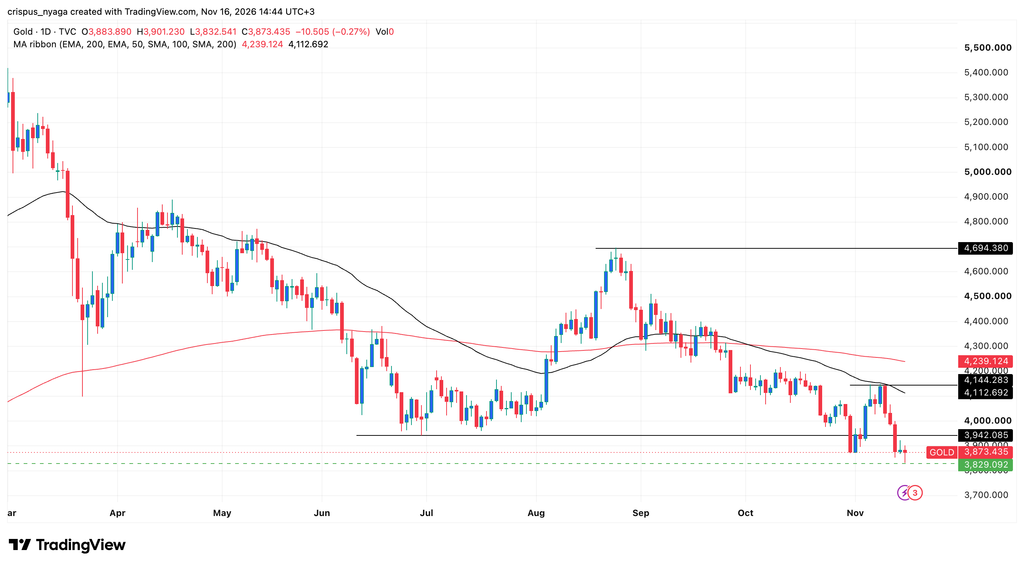
Gold price chart | Source: TradingView
The daily chart shows that the XAU/USD pair has been in a strong sell-off in the past few months. It has slumped from a high of 4,694 in August to a low of 3,829 today. A closer look shows it has moved below the important support level of 3,942, its lowest level in June this year.
The pair has formed a small double-bottom pattern whose neckline is at 4,145p. Therefore, there is a possibility that the pair will have a brief rebound, potentially to 3,942 and then resume the downward trend, potentially to 3,700.
What is your outlook on SPDR Gold Shares?
Anonymous · no sign-up · results from the last 30 days · not investment advice