


- GBP/USD closed Friday near 1.3214.
- Support is 1.3200; resistance is 1.3300.
- US inflation and UK data decide the next move.
- 1$1.3200 Key supportClosing below 1.3200 opens a test of October lows at 1.3140
- 2$1.3300 ResistanceClosing above 1.3300 indicates the current sell-off is losing momentum
- 3$1.3500 Key ceiling · ResistanceNamed as the key ceiling keeping the bigger trend down
- 4$1.3358 ResistanceFirst resistance level to be tested above 1.3300
- 5$1.3140 October low supportSupport at the lows set in October
- 6$1.3077 SupportLower dashed blue support line highlighted on the chart
TradingView Lightweight Charts™ · Yahoo Finance data
Sterling Gives Back Its Gains
Sterling had a bad week. The GBP/USD reached 1.3454 on Tuesday and then declined for the next four days closing at 1.3214 on Friday. This was a decrease of approximately 1% over the course of the week. The Bank of England increased its rate to 4% on November 5th, but even though this occurred, the value of the British Pound continued to fall. The cause of the decline in the value of the British Pound is due to the strength of the U.S. Dollar. At present time, the U.S. Dollar is trading at its highest level in 19 months.
Our GBP/USD forecast on the pound’s weekly drop has the full story. The Bank of England rate page shows the policy path. Now let’s read the chart together. Take your time. The picture tells a clear story.

Reading the GBP/USD Chart
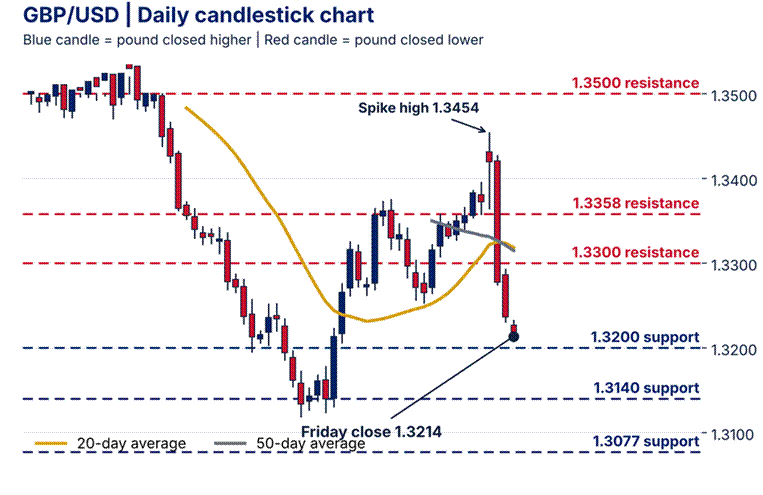
Start by looking at the colours. Candles in blue represent each day that the pound increased in price. Candles in red represent each day that the pound decreased in price. The gold line represents the 20-day average. The Gray line represents the 50-day average. Dashed red lines represent resistance levels at 1.3500, 1.3358 and 1.3300. Dashed blue lines represent support levels at 1.3200, 1.3140 and 1.3077. Next, look to the far right. The pound’s price rose to 1.3454; however, it fell back through 1.3358 and 1.3300. The previous four candles are red. The pound’s price is below both of its averages; therefore, sellers have control. Our GBP/USD technical analysis named 1.3500 as the key ceiling. A moving average helps you see that trend at a glance.
What Is Driving the Pair
Three things matter. First, US inflation. Producer prices rose 6.5% in October from a year earlier, the highest since 2022. Core consumer prices rose 0.3% in the month. Second, the Fed. Governor Christopher Waller has said a 0.3% core reading could justify a half-point hike. The Fed meets on 8 and 9 December, and the Federal Reserve calendar lists the dates. Third, the UK. Our report on why the pound fell after the Bank of England hike explains the gap between rates and price.
Scenarios and Outlook
Here is the shorter-term outlook. Bullish: closing above 1.3300 will indicate the current sell-off is losing momentum. The first level of resistance to be tested will be 1.3358. Bearish: closing below 1.3200 on a daily basis opens up the opportunity to test the lows set in October at approximately 1.3140. Neutral: the price may remain bound within the range of 1.3200-1.3300 due to mixed data. Employment figures are scheduled for release on Tuesday, while inflation figures from the United Kingdom are scheduled for release on Wednesday. Both come from the Office for National Statistics. Firm numbers would back another Bank hike. For the longer view, price stays below 1.3500, so the bigger trend is still down. See how this level worked last month in Cable battles 1.3390 resistance after UK inflation data.
Your Next Move
Where do you believe the cable will go from here? Choose the appropriate level prior to Tuesday. Establish your stop loss. At that point, allow the candlestick to close. Patience is superior to speculation. Minor incremental changes accumulate over time; therefore, patient traders tend to remain in business for an extended period of time. There may be abrupt price fluctuations in the near term; consequently, limit the size of your trades. Document your strategy and evaluate it at the conclusion of the week. This is generic information and should not be construed as individualized advice.
What is your outlook on GBP/USD?
Anonymous · no sign-up · results from the last 30 days · not investment advice