


- Anatomy: Single and multi-candle shapes indicate the immediate market sentiment and the possibility of a trend reversal.
- Placement: When there are clear trends near a support/resistance level, these will work best.
- Risk: Use confirmation candles and set stop-losses beyond wicks.
A candlestick is used to display the open, high, low, and close values for each time frame (period). Time frames include minutes, hours, or days. Every single candlestick represents a tiny story of both the buyers and the sellers. The grouping of one to three candlesticks creates signals called “candlestick patterns”. I am going to explain these to you in simple terms. You’ll learn how to interpret candlestick charts, find the most important patterns, and trade them responsibly.
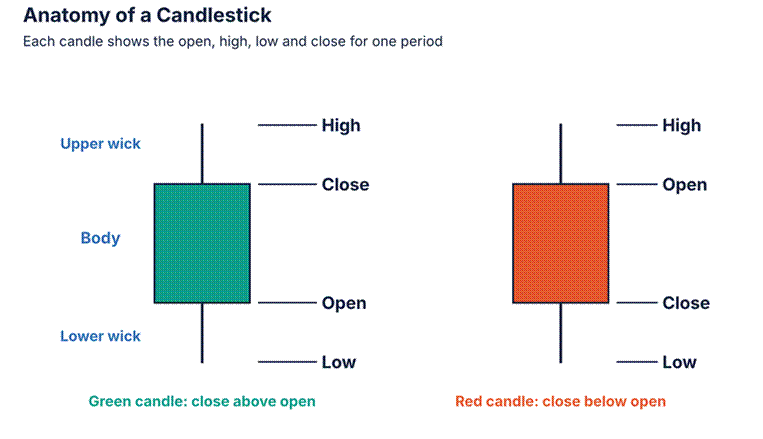
Image 1: A labelled candle. The body runs from open to close. The upper wick marks the high and the lower wick marks the low. A green candle closed higher than it opened. A red candle closed lower.
What Are Candlestick Patterns?
A candlestick is simple once you know the parts. Candlestick charts use shapes formed by either 1, 2 or 3 individual candles. Candlestick charts indicate a change of opinion from those buying to those selling. Traders first started using candlestick charts in Japan during the 1700’s. Currently, traders use candlestick charts for stock trading, currency trading and cryptocurrency trading. A candlestick chart cannot tell you what will happen next; however, it can give you an idea of what traders have done recently and possibly indicate what will occur after that.. Our guide to candlesticks and how to use them in trading is a good start. Bigger shapes, such as triangles and flags, use many candles. They are chart patterns, and we cover them in our Chart Patterns guide.
Why do you need to be concerned about this? Candles represent what people think. Greed and fear create trends that are visible on the charts. If you can analyse these trends, you will be able to identify changes in trend direction early. Additionally, candles allow you to place specific entry points for your trades, as well as define stop-loss levels, which will assist you with risk management. However, candles do not provide insight into major economic events such as interest rate decisions, inflation reports, or earnings announcements that also affect price movements. Therefore, you should utilize candles to determine the best times to enter the market, while using the news to determine why prices are moving.
How to Read Candlestick Charts: Body, Wicks, and Colores
In total there are three sections to learn. The body of the candlestick represents the difference between the open and close price. The “wicks” or “shadows” on either side of the body indicate the high and low prices. Finally, the colour of the body indicates the direction of movement. White (or green) bodies indicate that the close was higher than the open, while black (or red) bodies indicate that the close was lower than the open. A longer body suggests that the market had strong directional movement, whereas a shorter body suggests that the market was undecided. Additionally, long wicks/shadows indicate rejection; price moved to those levels, but was unable to remain there.. Always ask where the candle formed. A hammer at support means more than a hammer in mid-air.
An example of this would be: A stock opens for trading at 100. It goes up to 108. Then, It drops back down to 98. It closes at 106. This means the candle is green. Its body covers 100 to 106. Also, Its top wick goes to 108. Its bottom wick goes to 98. Although buyers were able to take control during that time, sellers did put on a strong push at one point.
Single Candlestick Patterns: Doji, Hammer, and Shooting Star
One-candle pattern is a simple way of identifying a single candlestick. While the single candlestick patterns can be easily found on your chart, you will have to confirm whether the single candlestick pattern is valid. Therefore, treat each one-candle pattern as a clue and not as an order.
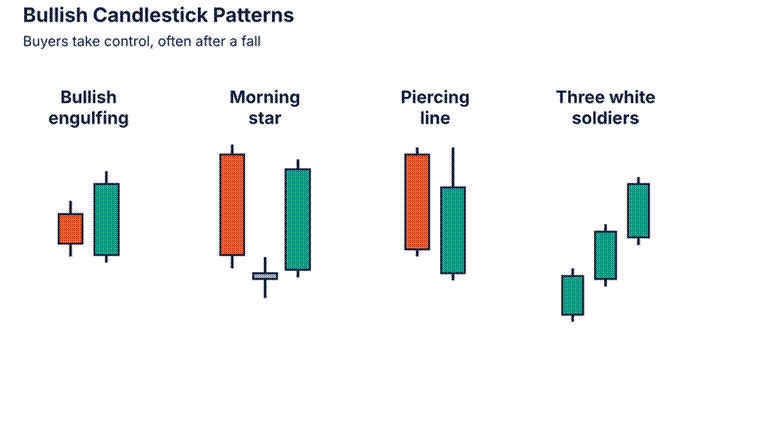
Image 2: Three single candles side by side. The Doji is a cross with almost equal open and close. The hammer has a small body and a long lower wick. The shooting star has a small body and a long upper wick.
Doji. It looks like a cross, with open and close almost equal. It signals doubt. Confirm it when the next candle closes clearly up or down.
Hammer. It has a small body on top and a long lower wick. It signals that sellers lost control at the lows, and a hammer after a fall can mark a bottom. Confirm it when the next candle closes above the hammer’s high.
Shooting star. It has a small body at the bottom and a long upper wick. It signals that buyers failed at the highs. Confirm it when the next candle closes below its low.
Bullish Candlestick Patterns
Bullish candlestick patterns hint that buyers are taking over. They work best after a fall and near support. Look for them after a clear drop, and check that price sits near support.
Four Bullish Patterns. The Bullish Engulfing Pattern is formed when a smaller red candle is followed by a larger green candle. The Morning Star Pattern is formed when a long red candle is followed by a small candle, which in turn is followed by a long green candle. The Piercing Line Pattern is formed when a green candle closes above the midpoint of a preceding red candle. The Three White Soldiers Pattern is formed by three consecutive rising green candles.
Bullish engulfing – A large green candle completely engulfs a small red candle. The buyers outnumber the sellers. You can confirm this pattern by closing above the top of the green candle.
Morning Star. The first is a long red candle. The second is a small candle. The third is a long green candle. This indicates that the market has reached its bottom. To confirm this signal, look for increased volume during the formation of the third candle.
A green candlestick closes above the center of a previous red candlestick. Buyers are beginning to make a comeback. To confirm this trend, watch for the next day’s close to be higher than the current day’s close.
Three White Soldiers – Three consecutive daily green bars that closed at a higher price than the previous day. This pattern is indicative of buying pressure. You should make sure that none of these three bars have a long upper wick.
Bearish Candlestick Patterns
Bearish candlestick formations indicate that sellers are beginning to control the market. These types of formations are most effective after an increase in price and when price is located near a level of resistance. Search for these formations after a definitive upward movement and make sure that price is at or close to a resistance level.
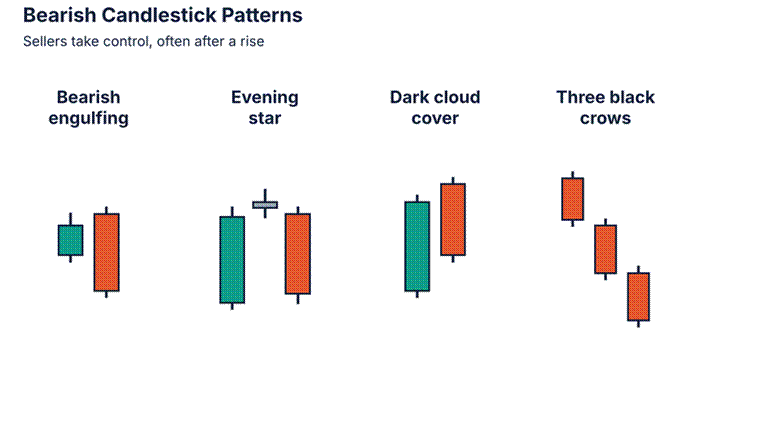
Image 4: There are four different types of bearish patterns. A bearish engulfing pattern occurs when a large red candle covers a small green candle. An evening star pattern consists of a long green candle followed by a small candle and finally a long red candle. A dark cloud cover pattern is formed when a red candle closes below the middle point of a green candle. Three black crows are a series of three decreasing red candles.

Bearish engulfing. A large red candle engulfs a smaller green candle. Sellers outweigh buyers. Confirmation occurs when the price closes beneath the lower edge of the red candle.
Evening Star: A long green candle is followed by a shorter candle and finally a long red candle. This indicates that the market has topped out. Confirmation can be made through increased volume during the formation of the last candle.
Dark cloud cover is formed when a red candle closes below the midpoint of the previous green candle. This indicates that sellers are starting to regain control. To confirm this pattern, look for a lower close on the following day.
Three black crows. Three long red candles, each with a lower close. This indicates heavy selling. Make sure there are no long lower wicks.
Reversal Candlestick Patterns and How to Trade Them
Reversal candlestick patterns are a warning sign that the direction of the market could change. Trading candlestick patterns is most effective when you have a strategy in place. First, identify the trend; the reversal must come from somewhere. Second, determine where support and resistance levels lie. Third, allow time to confirm the signal. Do not make trades based solely on the shape of the candle. Fourth, position your stop loss above or below the pattern’s wick. Fifth, set a target that is at least twice as large as the amount of money you are willing to lose.. Add RSI or volume for extra proof. See how candles meet resistance in our GBP/USD technical analysis.
What if the pattern fails? Then you exit. A failed signal is also information. If a bullish pattern fails at support, sellers are strong. Check major currency pairs and forex session times to pick the busiest hours, when patterns are cleaner.
Avoid common mistakes. Do not trade every pattern you see. Also, Do not ignore the trend. Do not skip the stop. A few clean setups beat many messy ones. Keep a journal. Write down the pattern, the level, the result and how you felt. Review it each week. Our free beginner articles cover more habits like this.
Candlestick Patterns Cheat Sheet
This candlestick patterns cheat sheet can be used for a fast review. The rows show each pattern, what kind of pattern it is, and what its main signal is. Traders will get a free candlestick patterns PDF of this same table with the guide. This is not a complete list of all candlestick patterns in a PDF format; however, it does contain those patterns that traders use the most. Print it out and place it beside your computer.
| Pattern | Type | Signal |
| Doji | Reversal | Doubt, possible turn |
| Hammer | Bullish | Bottom after a fall |
| Shooting star | Bearish | Top after a rise |
| Bullish engulfing | Bullish | Buyers take control |
| Morning star | Bullish | Bottom reversal |
| Piercing line | Bullish | Buyers fight back |
| Three white soldiers | Bullish | Strong uptrend starts |
| Bearish engulfing | Bearish | Sellers take control |
| Evening star | Bearish | Top reversal |
| Dark cloud cover | Bearish | Sellers fight back |
| Three black crows | Bearish | Strong downtrend starts |
Frequently Asked Questions About Candlestick Patterns
What is the most reliable candlestick pattern?
No trading pattern will work for you each time. However, there are some patterns that have been shown to be much more reliable than others. Some of the most reliable are the “engulfing patterns” that occur at support and resistance areas and have high volume. The context is more important than the actual pattern itself.
What does a Doji candlestick mean?
A Doji indicates that buyers and sellers finished the trading period with equal positions. Doji show indecision. Doji can signal an imminent trend reversal when they appear after an extended price movement.
How many candlestick patterns are there?
Depending on the person counting, lists of patterns may contain 40 to 60 items. Of those, most traders will use less than 10.
Do candlestick patterns work in forex and crypto?
Yes. Candles show prices; therefore, they are useful for trading in liquid markets. Crypto trades 24/7, therefore, there will be very few gaps. Fake signals exist in every market, therefore, confirm your signals.
Which timeframe is best for trading candlestick patterns?
The longer the time frame, for example, the four-hour and daily charts provide better signals. The shorter the time frame, the more noise is created. Select the time frame that best suits your trading method.
Which pattern do you plan to use first? You should create a demo account and select five examples to use each week. At the end of that week, take a look at how well those examples worked out. Also, share your findings with other traders and read through their comments on the same topics. Please note, this article is intended for educational purposes only and is not meant to be used as financial advice.