



- Shapes: Multi-candle structures are bullish, bearish, or neutral.
- Psychology: They reflect repeating cycles of market crowd behaviour.
- Targets: Traders use breakout levels and measured moves to set price goals.
Chart patterns are formed when prices are drawn by multiple candles. Candlestick patterns are formed when prices are drawn by 1 to 3 candles. Candles can be thought of as individual words and chart patterns as complete sentences. The purpose of this guide is to explain the primary types of chart patterns, demonstrate how to apply these patterns in trading, and provide a quick reference cheat sheet. If you are unfamiliar with candles, please review our Candlestick Patterns Guide prior to reading this guide.
What Are Chart Patterns in Trading?
A chart pattern is a recognisable shape in price. It forms as buyers and sellers push and pull. Traders use chart patterns to plan entries, stops and targets. Trading chart patterns does not need complex maths. You draw lines, wait for a break and manage risk. Patterns also work best when you know the trend. See how a falling trend looks in our look at EUR/JPY and its months-long decline.
How do you think those shapes are formed? Crowds will react to similar circumstances. Buyers buy when prices drop. Sellers sell when prices rise. Fear and greed continue to influence how people react to market conditions. Every time there is a new cycle of fear and greed, it produces a different shape on the charts. Therefore, we may see shapes and patterns being formed in various markets (stocks, forex, and cryptocurrency) which can be used for analysis. These patterns are not magical; they represent the behaviour of the crowd.
Continuation vs. Reversal Chart Patterns
Continuation patterns indicate a short break within a current trend. Price pauses before continuing on with the same movement. Consider this to be a brief pause, rather than a full halt. Common continuation patterns include flags and rectangles. Conversely, reversal patterns indicate that a trend has lost its momentum. Price will then begin to move in the opposite direction. Consider this to be a turn in the road. Common reversal patterns include head and shoulders and double tops. There are some patterns (such as triangles) that have the potential to break either way, and therefore they are considered neutral.
Why is the difference important? It affects how you will proceed. When trading using a continuation pattern you are following the current market direction (trend). When trading using a reversal pattern you are going against the previous market direction (trend) and therefore require more confirmation. Also, the presence of a clearly defined trend prior to the formation of a reversal pattern is required. A double top in a non-trending (sideways) market has very little significance.
Bullish Chart Patterns: Cup and Handle, Double Bottom, Bull Flag
The chart pattern examples above demonstrate that a bullish trend will lead to an increase in prices. The green line represents the breakout point; the red line is where you would place your stop loss order and the orange line indicates the target price.
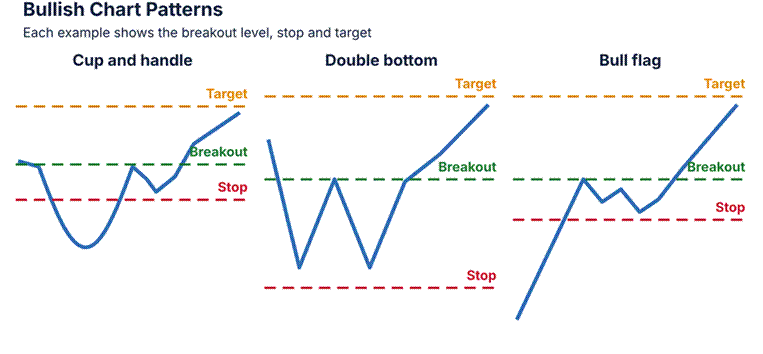
Image 1: Three bullish patterns represented by simple line drawings. A cup-and-handle pattern is shown with a rounded dip and a brief pullback. A double bottom pattern is displayed with two low points on the same plane. A bull flag pattern is illustrated with a rapid increase followed by a brief decline. All three of these examples are labelled with the location of breakout points, stops, and targets.
Cup and Handle Pattern. The price forms a rounded bottom, which is followed by a slight decline (or pullback). Breakout: above the highest point of the “handle.” Stop Loss: below the lowest point of the “handle.” Target: take the difference between the top of the “cup” and the bottom of the “cup” and apply that value to the breakout point.
Double bottom. Price tests the same low twice in a classic double bottom. Breakout: above the peak between the lows. Stop: below the two lows. Target: add the pattern’s height to the breakout.
Bull Flag. A large upward move in price, followed by a slight downward drift. Entry: Breakout above the highest point of the flag. Stop Loss: Below the lowest point of the flag. Take Profit: Add the height of the “pole” (the initial upward movement) to the entry level.
Try a simple example.
A stock breaks through the upper boundary of a flag formation at 50. The bottom of the flag formation is at 47; therefore, the stop-loss level would be placed at that location. The distance from the base of the flag to the top of the flag formation (the “pole”) is eight units. The profit objective is set at 58. Your risk is three units, and your potential reward is eight units. This appears to have a positive risk/reward ratio based on the numbers provided. However, actual market behaviour is unpredictable, and thus it is recommended that you maintain small positions.
Bearish Chart Patterns: Head and Shoulders, Double Top, Bear Flag
Bearish chart patterns point to lower prices. The head and shoulders is the best known.
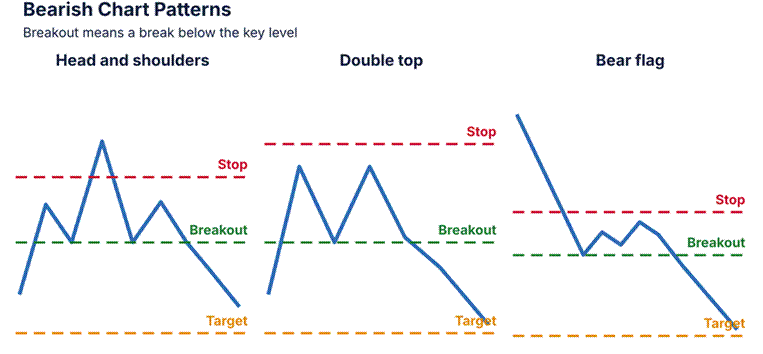
In Image 2, three types of bearish chart patterns are shown using simple line drawings. A “head & shoulder” pattern consists of three separate peaks; however, the center peak will be higher than the other two. A “double top” pattern will have two similar-sized peaks located on roughly the same plane. A “bear flag” pattern is characterized by a quick decline followed by a small increase. All of the above patterns have been clearly marked with labels representing breakouts, stops, and targets.
A head and shoulders pattern consists of three peaks, with the middle peak being the highest. A breakout will occur below the neckline. A stop loss can be placed above the right shoulder. To determine the target, subtract the height of the head from the neckline.
Double top – price fails to break through the same high on two separate occasions. Breakout – break through the bottom of the valley that is located between each peak. Stop loss – place above each of the peaks. Target – take away the size of the pattern.
The bear flag is a strong downward move, followed by a slight upward movement.
The breakout occurs when the price drops below the bottom of the bear flag. A stop order should be at the top of the bear flag. The target is calculated by subtracting the distance between the two extreme points on the flagpole.
A fast bearish example would be when a stock forms a head and shoulder pattern. The neck line for this stock is at 80. The head on top of the shoulders is at 90. That’s ten points higher than the neck line. Once the stock closes under 80, we have our target around 70. Our stop will go up on the right side of the head and shoulders, so our risk is less than what we are looking to make.
In most cases, the presence of a bearish pattern will occur after a prolonged rally. The most common characteristics that define a bearish pattern are slowing momentum, lower volumes as prices increase, and candles that decline toward resistance levels. Each of these three characteristics enhances the probability of the neckline being broken. Additionally, some traders examine the Relative Strength Index (RSI) to see if there is any evidence of weakness.
Neutral Patterns: Triangles, Wedges, and Rectangles
The neutral pattern is a compression. Wait until the price breaks through one side or the other before making a move.

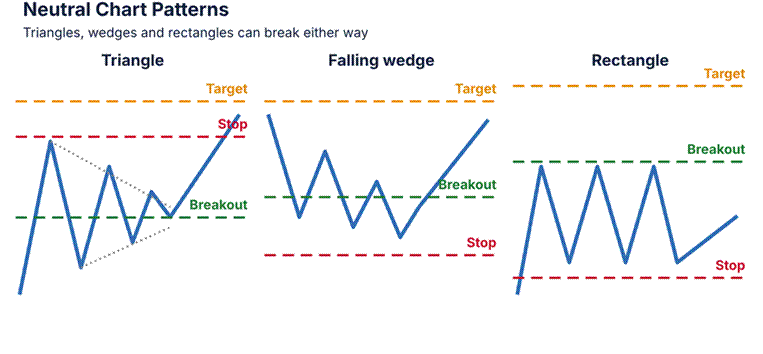
The image shows three different neutral patterns. The pattern on the left is a triangle that becomes narrower as the price of a stock falls (highs decrease) and rises (lows increase). On the right, is a falling wedge that slopes downward as it narrows. In the middle, is a rectangular pattern with horizontal support and resistance lines. All patterns have their respective breakout, stop, and target lines indicated by labels.
Triangles. High points are falling down; low points are going up. Breakout: Beyond one of the two trendlines. Stop: Return inside the triangle. Target: Take the distance between the two trendlines at their widest point and place it above/below the breakout point.
Wedges. Both lines slope in the same direction and get smaller. When a falling wedge breaks out, it goes higher. When a rising wedge breaks out, it goes lower. The target price will be equal to the wedge’s start height.
The price is bounded by two horizontal lines (support/resistance). When the price breaks out of the upper/lower boundary of these lines, it can move up/down to an amount equal to the distance between the two horizontal lines (the rectangle’s height).
An example of a triangle is helpful. For two weeks, the price squeezed between $100 and $104. Then it broke through $104 with heavy volume. The distance from the widest point in the triangle was 8 units (or dollars), therefore, our target price would be approximately $112. Our stop loss will sit back within the triangle, close to $101.
Neutral patterns teach patience.
Our free beginner articles cover alerts and risk. Do not guess the direction. Set alerts above and below the pattern. When price breaks one side with a strong candle and rising volume, act. If price breaks and snaps back inside, it may be a false break. Stay out until it is clear.
How to Trade Chart Patterns: Entry, Stop Loss, and Target
Keep it simple. You will be able to enter the market when a candle closes outside of the breakout zone. You can then place your stop loss order on the opposite side of the pattern. Your target is set by using the measure move technique. Make sure that your potential reward is at least twice as large as your possible loss. Reading volume is simple. Look at the volume bars located below the chart. High volume bars indicate strong interest in the breakouts. Most breakouts occur during periods of higher-than-average volume. Breakouts which occur during low volume periods tend to fail. If you prefer to enter the market after a retest, wait until that happens.
Use our silver price prediction to practise marking levels.
Avoid the usual traps. Do not enter before the breakout. Also, Do not set a stop too tight. Do not chase price after a big run. Do not ignore news such as rate decisions and jobs data. For the short-term and long-term views, use both. Check the daily chart for the big trend. Then use the hourly chart for entry. Our GBP/USD forecast shows support and resistance in action.
Chart Patterns Cheat Sheet
Use this chart patterns cheat sheet as a quick check. A free chart patterns PDF of this table comes with the guide. Print it and keep it next to your screen.
| Pattern | Bias | Expected move |
| Cup and handle | Bullish | Rise by cup depth |
| Double bottom | Bullish | Rise by pattern height |
| Bull flag | Bullish | Rise by pole length |
| Head and shoulders | Bearish | Fall by head height |
| Double top | Bearish | Fall by pattern height |
| Bear flag | Bearish | Fall by pole length |
| Symmetrical triangle | Neutral | Move by widest part |
| Wedge | Neutral | Move by starting height |
| Rectangle | Neutral | Move by box height |
Frequently Asked Questions About Chart Patterns
What is the most profitable chart pattern?
No pattern can be consistently profitable. Many traders prefer to use the “Head and Shoulders” and the “Cup and Handle.” Whether or not you are successful with these patterns depends on your ability to control risk and be patient. Prior to using real money, practice trading each of the above patterns using historical charts.
What is the difference between chart patterns and candlestick patterns?
The chart patterns have a large number of candles that are used to create the shapes. On the other hand, the candlestick patterns are created with either one, two or three candles. Therefore, both can be combined for the greatest results.
How do you confirm a chart pattern breakout?
Wait until you see that a single candle closes past the line of resistance/support. Also check to see if there is increase in volume. If there is a retest of the area where the break occurred, it provides additional evidence. A strong close will provide better confirmation than a rapid jump.
Do chart patterns work on all timeframes?
Yes, however, the longer the period, the better the reliability. There is a lot more weight to the daily and weekly patterns as opposed to those that occur every five minutes.
Which pattern would you look for first? Select a single chart to analyse this week, then illustrate that chart. After doing so, observe how the market reacts. Post about what you discovered to help other traders. This guide is an educational tool, not financial advice.