


- Nebius stock dropped after the company published its third-quarter earnings.
- The company’s revenue surged as demand for its services soared.
- It, however, lowered its guidance for the annual revenue.
InvestingCube chart · market data
Nebius Group shares plunged more than 17% on Thursday as the wider artificial intelligence (AI) sector sold off following Jensen Huang’s resignation. The decline was compounded by the company’s latest earnings report, which sent the stock down to $129. NBIS has now fallen over 56% from its yearly peak, with its market capitalization shrinking from $75 billion to $35 billion.
Nebius Group Tumbles After Earnings
NBIS stock dropped as AI companies fell after Jensen Huang, Nvidia’s founder, resigned amid intensified pressure. His resignation came a few days after he admitted to infidelity with a lady who is widely believed to be a spy. Allegations of an affair with an employee.
Huang’s resignation came as a shock because he has been one of the most influential figures in the AI industry. Under his leadership, Nvidia made a major investment in Nebius, becoming one of the company’s largest shareholders.
Nebius Group also plunged after releasing its earnings, which showed that its revenue continued growing. Its revenue surged by 571% YoY to $980 million, with its nine-month figure soaring to $1.96 billion. Part of this revenue was because of its non-recurring part, which was part of its asset-light model of its AI Cloud platform.

Most importantly, the company’s net loss narrowed to $37.5 million from $119.6 million in the same period last year. Most importantly, its nine-month net income jumped to $393 million.
Nebius shares dropped after earnings because of its significant depreciation, which moved to $354 million, equivalent to 36% of revenue. Also, the company lowered its forward guidance, which is between $3.0 billion and $3.4 billion.
Nebius Stock Price Technical Analysis
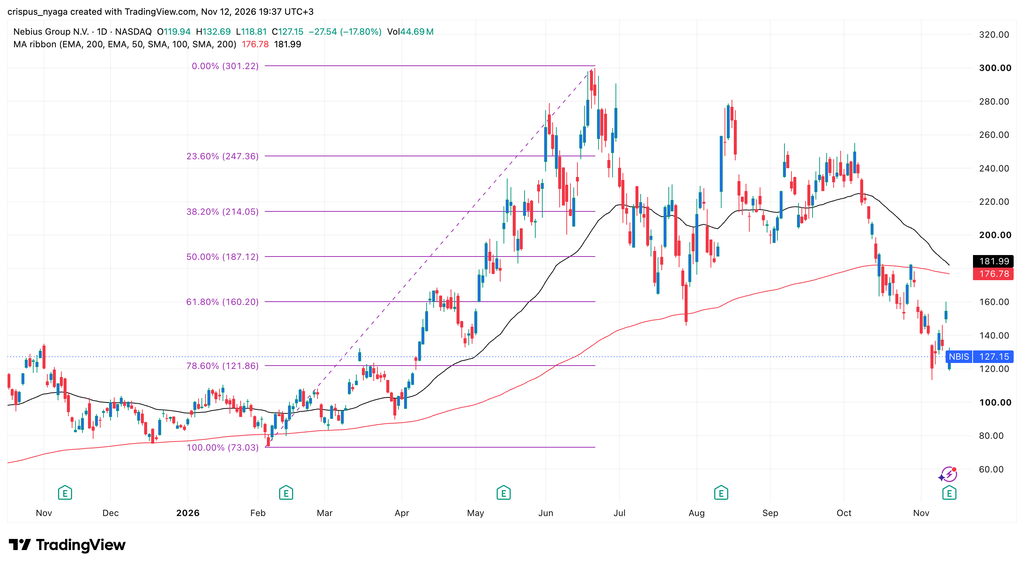
NBIS stock chart | Source: TradingView
The daily chart shows that the NBIS stock has been under pressure in the past few months, mirroring the performance of other neocloud companies. It has dropped from a high of $301 in June to the current $130.
The stock has dropped below the 61.8% Fibonacci Retracement level. Moving below that level is a sign that bears remain in control. It has also plunged below the 50-day Exponential Moving Average (EMA).
These technicals suggest that the stock has more downside to go. If this happens, the next key target to watch will be at $100, which is about 22% below the current level. On the other hand, a move above the key resistance level of $150 will invalidate the bearish outlook.
What is your outlook on Nebius Group?
Anonymous · no sign-up · results from the last 30 days · not investment advice