



- CAC 40 is trading around the short-term support level of 8,065 and the pivot point of 8,111.44.
- Momentum is weak and over-sold; therefore, we may have a potential for a rebound although there is no certainty that this will occur.
- Watch for support levels, the pivot points and which way the bond market is headed prior to responding to the next price action.
InvestingCube chart · market data
The CAC 40 is currently trading close to its short-term support. The daily closing price is now likely to be more important than the overall day’s change in price. This chart displays the current price relative to major technical levels and should be used as an aid in making trading decisions rather than a forecasting tool.
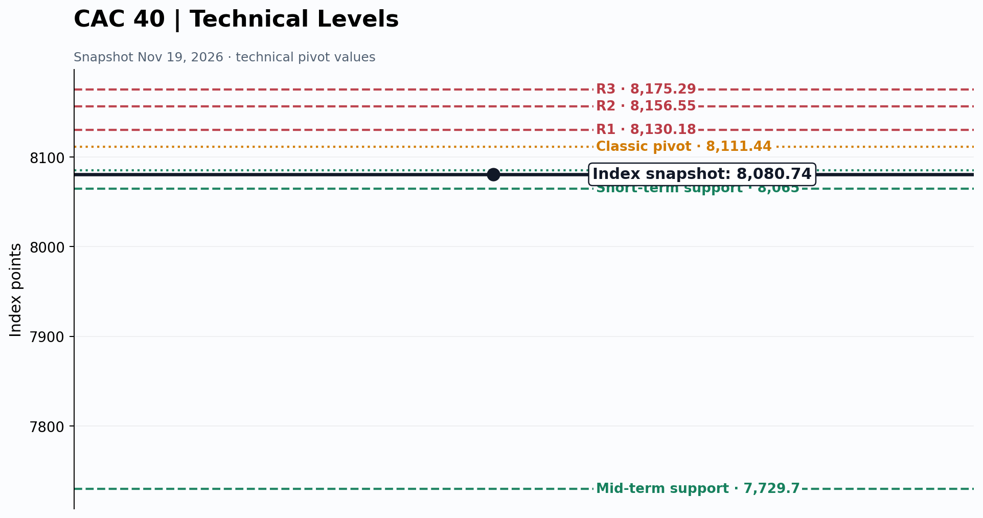
Technical level map · Latest available snapshot
French shares face a test of confidence
The CAC 40 ended the most recent picture of performance at approximately 8,080.74, lower for the day and very near a short-term level of support at approximately 8,065. The index provides an immediate assessment of the performance of major French businesses, but it is also reflective of overall investor confidence or risk aversion. There are several factors that can impact the performance of the Paris stock exchange including U.S. Treasury Bond Yields, Euro exchange rate movements, Energy Price changes, and Investor Earnings Forecasts.
The index is now in a technically weak position. All three of the moving average timeframes (short, medium, and long) have indicated sell signals. The RSI was at approximately 21, which represents an extremely oversold condition; however, the MACD is still indicating a bearish trend. These two indicators suggest there is strong selling pressure on the index. On the other hand, they could represent potential for a rapid recovery rally.
The key issue for investors is not if the stock market index has declined far enough, but if buyers will support the current price support levels. Even though a support level may hold for several hours, it may ultimately fail at the end of the day. More importantly, the daily close and how the market reacts during the next trading day will provide greater insight into whether or not the support level was successful than a short-term rally.
Reading the CAC 40 technical chart
The chart below has the index snapshot of 8,080.74 listed beside the technical levels. Short term support is approximately 8,065. The classic pivot S1 is 8,085.07. The classic pivot is 8,111.44. Resistance levels are 8,130.18, 8,156.55, and 8,175.29. A broader medium-term support level reference point is 7,729.7.
The short-term bias remains weak due to the price being close to the lower support zone and below the classical pivot. If the index closes below 8,065 and does not recover quickly, sellers will most likely try to test lower support zones. It would take a long time for the index to reach 7,729.7, which is part of a larger timeframe and shouldn’t be considered an immediate objective.
The index will be in a better mood if it can close above 8,111.44, however, buyers will have to take action. If the index closes above 8,130.18, this may indicate that the index is regaining momentum. The next key level to watch for is 8,156.55. These levels were calculated based on the previous trading session’s pivot point. It is recommended that these levels be updated daily and used as a guide.
Oversold does not mean the selling is finished
In the most recent technical snapshot, the RSI (14) was at 21.217. When the RSI falls below 30, it is typically considered to be in an oversold state. This indicates that the current downward trend has been very strong, however, it does not indicate whether a reversal will occur. The momentum may remain weak if investors continue to sell their positions, particularly as the overall economic conditions and/or earnings forecasts change.
The 20-day Simple Moving Average (SMA) was at approximately 8,175.49, and the 50-day SMA was at about 8,279.57. Both of these are above the current Index value. This discrepancy indicates that Price is now Trading Below recent Trend Indicators. Any Recovery toward these SMAs could result in Traders that previously Purchased Shares selling them off to Lower their Risk Profile.
The ATR that was stated in the report was 27.63, which indicated high volatility. This is significant when it comes to setting stops and determining how large each position can be. If you use a tight stop, you may find yourself being stopped out of your position on a regular basis due to the day-to-day fluctuations of the market. On the other hand, if you want to take on more risk than you normally would with a single stock, you will need to invest less money per share. In addition, there are differences between trading an index and having long-term exposure to the stock market through a variety of different types of funds.
What could move the French benchmark
Earnings are a large driver. Many of the companies that make up the CAC 40 operate globally. Therefore, their stock price can be affected by US demand for their products/services, Chinese economic growth, currency exchange rates, rising or falling energy prices and what they say about future performance. When the Euro falls against other currencies, it makes it cheaper for those French businesses to sell their goods and services internationally. Conversely, as the cost of producing these goods and services increases, many French businesses will see lower profits. It is important to remember that the CAC 40 is not an accurate reflection of how well the French domestic economy is performing.
In addition to other factors, interest rate levels will impact how attractive equities are relative to fixed income investments (bonds). When yields are high, there is less incentive to invest in equities, and when yields are low, there is more incentive to invest in equities. Interest rates also affect the discount rate used to calculate the present value of future earnings. Investors’ expectations regarding monetary policy can also affect whether equity valuations remain supported by current trends. However, regardless of what investors believe about monetary policy, they will ultimately need to see some evidence that company earnings can continue to support equity valuations. While investor expectations regarding interest rates may be sufficient to boost many stocks’ prices, they will not be enough to sustain an entire bull market.
Also note
Changes in politics and finances will have an impact on investor confidence, particularly if there are concerns about the stability of the budget or the level of public debt. News from Paris may have an influence on French assets; however, most of the time, global influences will determine how markets move each day. It would be wise for traders to monitor both the local calendar and key global events.
For context, readers can compare this decline with InvestingCube’s Nasdaq 100 analysis.
Its S&P 500 market outlook helps show how equity sentiment and technology-led volatility can spill across regions.

Investors can also review the ETF guide to understand how broad index exposure differs from owning individual shares and what fund risks to check.
Three scenarios for the CAC 40
Bullish Scenario: If the index holds on at 8065 and breaks above 8111.44 again, buyers will break through the next level of resistance at 8130.18, which shows that the immediate downward pressure on the index has subsided. If the index can maintain itself above 8156.55 for an extended period of time, it will show even stronger signs that the index is recovering. The bullish case will be much stronger if bond yields fall and corporate earnings forecasts remain positive.
Bearish case: The index will finish below 8,065, with the selling continuing. The current chart will continue to be under pressure, as traders look to find the next lower support level. If the index remains in a downward trend, then it may try to reach broad-based support levels at or around 7,729.7. One day of closing above/below support does not necessarily make a pattern; keep an eye on how the index finishes each day and what happens if it attempts to re-test the support level.
Neutral Scenario: The CAC 40 will trade within the range of approximately 8,065-8,111 in a lateral fashion. As the RSI begins to recover, the CAC 40 will remain below its current level of resistance. This suggests that both bulls (buyers) and bears (sellers) are waiting for clearer macroeconomic or earnings signals before committing themselves. While a trading range may cause frustration among investors, it could ultimately decrease the amount of reaction necessary to each headline.
Why the index matters beyond France
Portfolios with European equity funds, international ETFs and/or individual French stocks could be affected by the performance of the CAC 40. A fall in the CAC 40 could cause the value of a portfolio’s fund(s) to decrease, however, this depends upon the weight of the index within the fund, the fund’s construction and the currency used. Therefore, investors should review what they own in their funds as opposed to making assumptions about whether or not their fund mirrors the performance of the CAC 40.
The index can be used as a sentiment gauge too. If the largest French companies decline together, it could indicate a general macro problem, not just an individual company’s problem. Therefore, examining the breadth of stock market moves, how sectors perform relative to each other, and how analyst earnings estimates are revised will provide additional insight. There is a distinction between a rally based on only a couple of stocks and one that has widespread participation.
When investing and not trading, don’t base all of your investment decisions on the daily charts. Consider what you want to achieve with the funds, how much concentration you want in your portfolio and whether or not you will need access to these funds in the near future. If you will need to access the funds in the next few years, then you should consider whether or not to invest in equities. Equities have historically had more volatility than other types of investments. If you plan to hold onto the funds for a longer period of time, then you should first determine why you bought the funds initially, before deciding how to react to a drop in the stock market.
A practical plan for the coming sessions
The support level around 8,065 is your initial test. Your initial recovery marker will be the pivot at 8,111.44. When you pass through that point, check for potential recovery markers at 8,130.18 and 8,156.55. If price drops below the support level, take some time to assess what has happened before you assume that there will be an immediate recovery. These levels are reference points only; they are not guarantees.
Use the chart along with the calendar. A variety of factors can move the index including earnings reports, comments from central banks, inflation data, and bond market movements. After a surprising event, the market can open at a higher or lower level than expected. When developing your plan, avoid creating one that relies on price moving smoothly and slowly.
For a broader introduction to chart reading, InvestingCube’s technical analysis guide walks through trend, support and resistance, indicators and risk. It is a useful reminder that no single signal should carry the decision.
Breadth and sector leadership offer extra clues
The next step would be to examine the market breadth. For example, if the entire market is dropping and a majority of the stocks within that market are declining, then we know there has been a general sell off. On the other hand, if there are only a couple of large capitalization companies (heavyweights) that are accounting for most of the decrease, the market might appear to be weaker than what the typical stock is experiencing. We could also look at how each sector has performed to determine if it was banks, industrial companies, luxury retailers, oil/energy companies, or technology firms that were driving the overall performance.
Although volume cannot be analysed on its own, it can provide additional information. If a stock drops below its support level with high trading volume, then this may indicate strong selling pressure. On the other hand, if a stock moves down slightly, but with relatively low trading volume, it could still have some significance, especially if there is little liquidity in that particular security. Finally, pay attention to how the market closes and opens the following day to determine whether the market accepts the lower prices or returns immediately to the previous price levels.
Long-term investors should consider what is driving the index. The indexes’ earnings, debt, profit margin, order book and outlook may vary from the index performance chart. While an index fund offers diversification, it does not eliminate the potential for the entire region/sector to decline. Be sure to align the investment with your financial objective(s) and do not use a support level that is based upon short-term price movements as the primary basis for purchasing.
Keep the technical signal in context
The technical level will provide a stronger signal to the user as long as there is an indication of what is happening in the overall market. As an example, if the CAC 40 maintains its support, the European bonds are declining and the major sectors are stabilizing then the recovery can be more solid. On the other hand, if the CAC 40 recovers but the bonds increase in value and the earning guidance declines then the recovery may be weak. Therefore, compare the chart to the economic calendar and company news prior to coming to a decision.
FAQ
Are we seeing a bearish trend for the CAC 40? The most recent technical data shows us a very bearish signal on all moving averages; a negative MACD; and an RSI of around 21. While the short-term picture may be weak, it is possible that there will be a bounce-back from the extremely low RSI readings.
What are the levels of support? The chart shows short-term support at approximately 8,065 and long-term support at approximately 7,729.7. Both types of support have different timeframes.
A recovery signals when we reclaim the 8,111.44 pivot and subsequently clear the 8,130.18 level to enhance the near-term technical picture. It is more important to close above those levels on a daily basis than it is to just have a short-term spike above those levels.
What is your outlook on CAC 40?
Anonymous · no sign-up · results from the last 30 days · not investment advice