



- DAX trades around 25,736 and remains under pressure.
- Support: 25,723 and 25,648; overhead reference: 25,773; pivot: 25,847.
- Oversold RSI could prompt a bounce, but confirmation is still needed.
InvestingCube chart · Yahoo Finance data
A Heavy Session for German Shares
The DAX was in decline at the time of this writing (November 19) at approximately 25,736. The decline of the European markets was caused by a “risk-off” move that impacted German export-heavy benchmark. Investors will watch the movement of bond yields, global tech stock performance, and any evidence of slowing demand. This decline is more than just a technical issue, as it may indicate changes in the growth expectations for the region. Our recent DAX index analysis looks at the same market backdrop.
Support and Resistance Levels
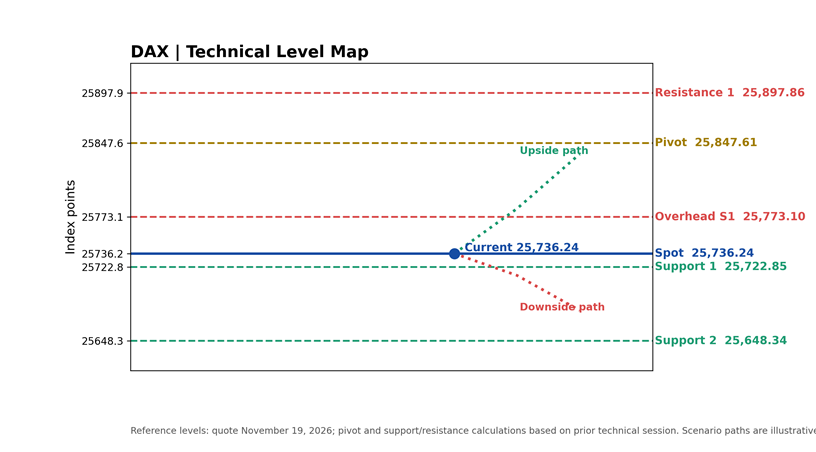
Chart note: Horizontal markers show the quoted price and reference levels. Dotted paths are illustrative scenarios, not predictions.
Data source: Investing.com DAX technical data
Support and Resistance Levels
The Level Map is showing the Index at a position just below the Classic Pivot which is approximately 25,847. Since the Index dropped below 25,773; this could potentially represent an Upper Resistance Area. There are two areas of support for the Index; one area is located at around 25,723 and the other is at 25,648. If the Index breaks through the bottom band of support, then it will become susceptible to more downward pressure. Traders looking to take positions on the long side of the trade may want to look for potential entry points near 25,898, 25,972 and 26,023. If price moves above or below a trend line, but then quickly moves back to its original direction; this may indicate that the original movement was a false break-out/break-down and not the beginning of a new trend. Because the closest support/resistance levels are very close together; a sharp movement in price can cause the Index to cross multiple levels within one trading day.
Momentum Favors Sellers
The trend is still on the downside. The 14-day RSI is well below 30, indicating that the market is currently in an oversold state. In addition to the RSI, both MACD and the moving average indicate that there is continuing downward pressure on the index. While the index being oversold may result in some short-term buying interest, being oversold does not guarantee that the index has reached its lowest point. To provide the index with a much more solid technical reason for buying, the index must get back above the pivot level and stay above it.
For a wider market perspective, see our S&P 500 guide, which outlines how global equity moves can influence diversified portfolios. That combination argues for patience instead of buying simply because the index has fallen.
Bullish, Bearish and Neutral Scenarios
The bullish scenario begins with a recovery above 25,847, followed by a move through 25,898. That could bring the 25,972 area into view. The bearish case is a decisive close below 25,648, especially if selling volume expands. A neutral session would keep the DAX within the current support-resistance band as traders digest economic releases. Our beginner investing guide explains why investors should avoid reacting to every daily swing. Confirmation of the turn (by breadth and volume) would allow for us to tell if it is a long-term trend change or a short-term rally.
The Next Confirmation
Keep your eyes on the German business survey, the Eurozone inflation rate, government bond rates and the top corporate earnings reports. If the Dax moves higher from its current position then we should be looking at continued upward momentum in the short-term and not just one day of gains. However, if the Dax breaks below support levels we cannot assume that the next lower level of support will be strong enough to provide support. While the chart provides us with a decision-making process we need to consider how close to the closing price we are as opposed to intraday headlines. The close of the market is far more informative than a short-term movement throughout the trading day.

With the current pullback, long term investors can take a look at their portfolio concentrations, risk levels, and cash requirements. Short-term traders should use the pivot point and the close support levels to develop a better trading strategy. Both groups of investors need to establish a clear exit point prior to entering into a position. Today, the DAX is still vulnerable. If the DAX closes above 25,898 then things look better for the DAX. However, if the DAX closes below 25,648 then the DAX continues to have downward pressure on it. Do not assume that either scenario will occur. After the market closes, check out where the DAX closed and see how much volume was traded at those prices. Volume confirmation adds additional credibility to the directional break. For more information about diversification through ETFs please see our ETF Guide.
Frequently Asked Questions
What is the DAX support zone?
The level map identifies support references at 25,723 and 25,648, with the possibility of overhead resistance at 25,773.
Is the DAX oversold?
The most recent technological picture has provided a very large oversold relative strength index (RSI). RSI being oversold does not indicate that we are at the bottom.
What would improve the DAX outlook?
A comeback to the area of the pivot at approximately 25,847 and the resistance zone of about 25,898 would help strengthen the short-term technical picture.
Technical Analysis provides information; it does not provide investment advice. Investing can involve risks.
What is your outlook on DAX?
Anonymous · no sign-up · results from the last 30 days · not investment advice