



- Spot is near 174.95, with momentum broadly mixed.
- Support: 174.77, 174.66 and 174.60; pivot 174.83.
- A sustained break above 175.00 or below 174.77 could guide direction.
InvestingCube chart · Yahoo Finance data
A Cross at a Turning Point
The EUR/JPY exchange rate is currently sitting around 174.95 as of November 19th. The yen has been on a strong run recently after having been in a period of weakness. As a result, the EUR/JPY pair is now sitting below its most recent high levels and buyers are going to need to defend these support levels. When the yen gets stronger it will impact Japanese exporters and their ability to earn money overseas as well as how much it costs tourists to travel to Japan. Our latest EUR/JPY outlook explains the wider pressure on the cross.
What the Technical Map Says
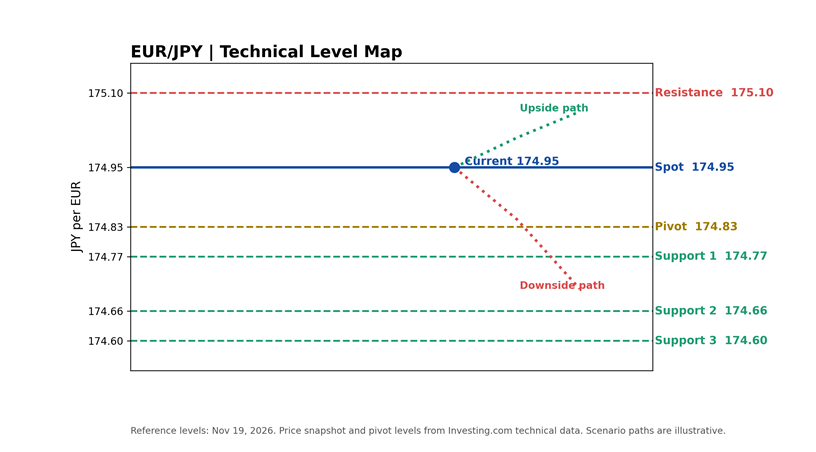
Chart note: Horizontal markers show the quoted price and reference levels. Dotted paths are illustrative scenarios, not predictions.
Data source: Investing.com EUR/JPY technical data, November 19
What the Technical Map Says
The chart illustrates the price of the stock relative to nearby pivot points. One of the best dividing lines on the chart is the 174.83 Classic Pivot. Support can be found at approximately 174.77, 174.66 and 174.60. If the price falls below those support zones it will indicate that the sellers have gained the upper hand. Resistance starts around 174.94 and goes up to 175.00 and 175.11. To demonstrate a better recovery, the price must get back above those resistance zones. Since these resistance and support levels are close to each other, a single quick move through one level may not provide confirmation of a trend.
Momentum Is Mixed
The momentum readings show a somewhat conflicting story. The RSI is currently at approximately 50%; therefore, it is not either overextended or under-extended. In addition, the short-term moving average(s) have formed a cluster around the current price; however, the longer-term moving average(s) such as the 50-day moving average, are still higher. That leaves room for a bounce, but it does not yet establish a sustained reversal. Traders can review our S&P 500 guide before using averages as confirmation. Keep a close watch on Japan inflation, Bank of Japan comments, and euro-area data. Any of these could lead to a quick change in the rate outlook. The chart is simply a “level map,” not a guarantee of direction. You should always use this chart in conjunction with the calendar, and you should never make a trading decision based solely upon one indicator.
Three Paths for EUR/JPY
For a bullish outcome, price must remain above 174.83 and close above 175.00. If price closes above 175.11, this will increase the likelihood of a larger trend reversal. On the other hand, the bearish path is established if price falls below 174.77. This will bring into play 174.66 and 174.60. Lastly, a neutral scenario will occur if price remains within the range of the pivot point and initial support level as traders await new economic releases. For context on European equities and risk appetite, our DAX outlook offers another read on regional sentiment. A weaker euro-area outlook could also keep pressure on the pair.
What Traders Should Watch
Wait for a breakout, and a retest, rather than chasing a candle. A level that is broken, and subsequently held, will usually have more significance than an intraday spikes in price. Also, pay attention to the yield spread between the Euro Area and Japan. When this spread closes, it can be a positive factor for the Japanese Yen. Conversely, when this spread expands, the Euro/Yen pair may see buyers. This pair can make large moves on policy-related news; therefore, your position size should reflect this risk.. Our ETF guide explains diversification for investors who want broader exposure without relying on one currency trade. The check of your exposures will provide you with a way to avoid having a small currency movement become an unexpected large portfolio change.

Before entering into short-term trades, investors should define their invalidation point clearly. Investors who have a long-term view of their investments can follow policy trends as opposed to being concerned with day-to-day noise. Currently, the chart indicates that the currency pair is in a decision zone and not a breakout. On the downside, pay attention to 174.77, and on the upside, watch 175.00. The direction of the break of these levels may indicate what direction the market will take in the following trading period. Having a disciplined strategy is more beneficial than having a confident forecast.
Frequently Asked Questions
What is the EUR/JPY pivot today?
The standard pivot point is near 174.83. This can be used to set a reference for your trading day; however, it does not mean there will be an immediate reversal of price action.
Where is EUR/JPY support?
The chart highlights 174.77, 174.66 and 174.60 as nearby support references.
What could lift EUR/JPY?
A break out of 175.00 and 175.11, as well as shifts in ECB and/or BoJ interest rate expectations, may provide support for a rally.
Technical Analysis is solely for educational/informational purposes and does not provide investment recommendations. All trades involve risk.
What is your outlook on EUR/JPY?
Anonymous · no sign-up · results from the last 30 days · not investment advice