


- Nasdaq 100 sits near 27,000, about 14% below its record.
- Support is 27,000 and 26,450; resistance is 28,100.
- Chip stocks and Fed hike bets drive the mood.
InvestingCube chart · Yahoo Finance data
A Rough November for Tech
The Nasdaq 100 has been having the worst November since 2008. On Monday, the index lost 2.67%, while ending Tuesday’s trading day close to 27,000. This is down from its highest ever level of 31,365 on October 6, representing a decrease of approximately 14%. Nvidia reported earnings after the market closed on Tuesday. While Nvidia exceeded analyst expectations for revenue with $115.8 billion, concerns about new US export restrictions for AI chips and the departure of their CEO continue to make investors uneasy.. Check exchange facts at Nasdaq. Our Nvidia earnings preview set up this test.
Walking Through the Nasdaq 100 Chart
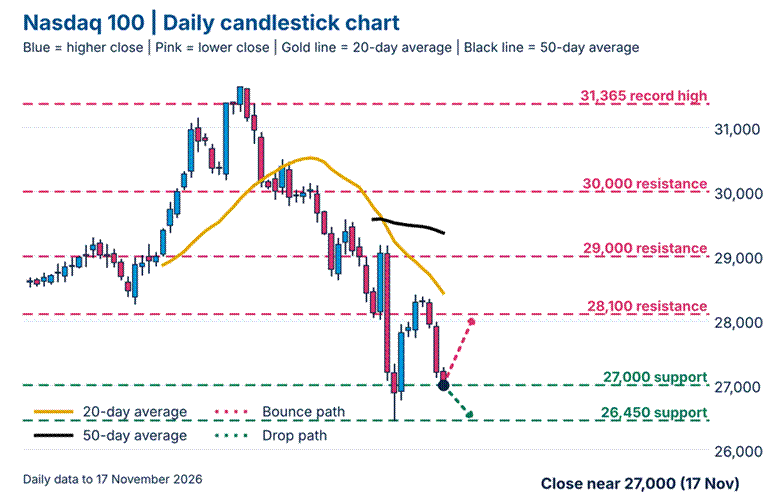
Let’s look at the chart. Each candle represents a single day. Blue candles represent days when the closing price was above the opening price. Pink candles represent days when the closing price was below the opening price. The gold line represents the 20-day simple moving average (SMA) of prices. The black line represents the 50-day SMA of prices. Both lines are sloping downwards, indicating that sellers are currently controlling the trend. Resistance levels are represented by pink dashed lines and include 28,100, 29,000, 30,000, and the previous record high of 31,365. Support levels are represented by green dashed lines and include 27,000 and 26,450. The large pink candle to the right is the rapid decline in prices that occurred during the first week of November. Buyers quickly rebounded after hitting a low of 26,450, pushing prices back up. This low point is significant as price is currently sitting at 27,000. Dotted arrows indicate that price may bounce toward 28,100 or fall toward 26,450. Read about the relative strength index too, because analysts say it sits below 50. See how Asia reacted in our Nikkei 225 report.
What Is Driving It
Several forces are at work. Stretched valuations make tech fragile. Chip stocks are having their worst two months since 2008, according to 24/7 Wall St. The Fed held rates last month, but traders saw a high chance of a December hike. Higher yields hurt growth stocks. Our Nasdaq 100 outlook on tech earnings and AI valuations flagged this risk. The Federal Reserve meets again in December.
Three Scenarios
Bullish – Nvidia’s beat has pushed chips higher, and the close was over 28,100, which is where the 200-day moving average lies. Next up would be 29,000. Bearish – If the closing price falls below 27,000 it will open up 26,450. Neutral – The price could swing around 27,000 to 28,100 for some time. In the short term there should be large moves. The average daily movement in November is about 1.9%. In the long-term analysts at forex.com are watching 26,450 as the 61.8% fib level from the upward trend that started at 22,780. Read Nvidia’s full report on SEC EDGAR. Wall Street’s mood can turn fast, as our Dow Jones report showed.
Why It Matters for Investors
Many people have a stake in the Nasdaq 100 and don’t realize that they do. These stocks are held by index funds and ETFs. A drop as large as the one seen last week has a direct impact on savings and retirement accounts. It also tests investor resolve. While many long-term investors continue to invest during down markets, they do so use funds that they do not plan to use in the near future. Before the next major market move, understand what level of risk you are willing to accept.
What Happens Next?
Can Nvidia’s strong report turn things around? Or is this just a brief pause in what could be a long decline? Look at 27,000 carefully. What do you see?

FAQ
Why is the Nasdaq 100 falling in November?
The combination of high technology stock valuations, the US government’s restrictions on exporting AI chips, and the departure of NVIDIA’s CEO, have negatively affected market sentiment. As a result, semiconductor stocks have had the worst performance for the last two months in 15 years.
What is the key Nasdaq 100 levels to watch?
Support sits at 27,000 and 26,450. Resistance sits at 28,100, 29,000 and 30,000. The record high is 31,365.
Did Nvidia’s earnings help the Nasdaq 100?
Nvidia reported revenue of $115.8 billion which exceeded analyst expectations. As a result, Nvidia’s share price increased during extended trading hours. Whether this will cause the index to rise depends on how investors respond over the coming days.
What is your outlook on Nasdaq 100?
Anonymous · no sign-up · results from the last 30 days · not investment advice