



- Copper is near $13,185, close to a four-month low.
- Support is 13,144; resistance is 13,545.
- China demand and AI spending fears lead the news.
InvestingCube chart · market data
Dr. Copper Hits a Four-Month Low
Copper has dropped almost 10 percent from its all-time high. The LME (London Metal Exchange) reported copper at $13,144/tonne on Nov. 17th. This was the lowest level for copper since mid-July. Traders use the term “Dr. Copper” to describe copper because it can indicate whether the world economy is growing or slowing down. When the price of copper decreases, many people will ask if there is less demand. Start with the official prices at the London Metal Exchange. Then see how metals are behaving in our gold price forecast.
Reading the Copper Chart
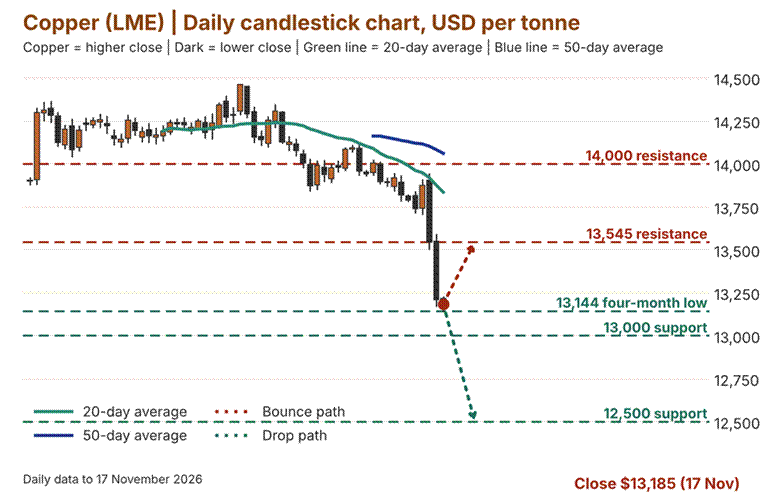
The above chart represents each candle as one day. A copper candle represents a higher closing price. A dark candle represents a lower closing price. The green line is the 20-day moving average. The blue line is the 50-day moving average. Currently, copper prices are trading far below each of those two averages. Additionally, the 20-day average has turned downward; therefore, the current trend is considered weak. The red dashed lines represent resistance levels located around 13,545 and 14,000. On the other hand, the green dashed lines represent support levels located around 13,144, 13,000 and 12,500. Now, let us examine the extreme decline that took place on the right side of the chart. Copper dropped dramatically from approximately 13,900 to 13,185 over three days. This was an incredibly steep drop. Finally, the dotted arrows illustrate either a rebound back up to approximately 13,545 or a continuation of the decline toward 12,500. Silver faces a similar test, as our silver price prediction explains.
What Is Pushing Copper Down
Demand worries lead the list. China uses more than half of the world’s copper, and its demand looks soft. Fears of slower AI spending add pressure, because data centres use a lot of copper. SP Angel notes a short-term supply squeeze in Shanghai, which keeps the picture messy. The International Copper Study Group publishes supply and demand data worth checking. Cheaper oil can help growth, but it can also hint at slower activity, as our Brent outlook shows.
Three Scenarios
Bullish: Copper closes above 13,545. This indicates that there is a resumption of buying activity in the market, with 14,000 being the immediate target. Bearish: If copper closes below 13,144, it will indicate that 13,000 and 12,500 levels are now viable targets. Neutral: Copper continues to trade in the range of 13,144 to 13,545, as traders continue to monitor developments from China. Short-term, the neutral scenario appears to be most likely. However, long-term, several banks (such as JPMorgan) have already identified potential supply deficits in the future.. Read the US Geological Survey copper facts for the supply side. Cooler inflation can lift risk assets, as our Dow Jones report showed.
Why It Matters for Investors
Copper isn’t just about trading. Copper is used by miners, utilities companies and anyone with an interest in the industrial sector. Mining stock prices tend to fall when copper prices fall. A declining copper price can indicate a decline in manufacturing activity. When the copper price stabilizes, it may help to calm a volatile market. How much of your investments depend on economic growth? Today’s small check can reduce anxiety later. Stay calm, examine your investment plan and don’t make rash decisions.

What Happens Next?
Will this drop represent an opportunity, or a sign of trouble? Keep an eye on 13,144. If we close below that level, the plot changes. How do you plan to trade it?
FAQ
Why is the copper price falling?
Traders are concerned about a weak level of interest in buying from China, the country that consumes more than half of the world’s total consumption of copper. There is also concern about whether spending on Artificial Intelligence will slow down, due to the fact that data centres consume large quantities of copper.
What are the key copper levels to watch?
Resistance is located at 13,545 and 14,000 per ton. Support is located at 13,144, 13,000 and 12,500. A closing below 13,144 will indicate a negative trend.
Why is copper called Dr. Copper?
Copper is used in construction, energy production, automotive manufacturing and electronic devices. As such, the value of copper usually follows the trend of global economic development. Traders consider the price of copper to be a gauge of the overall condition of the world economy.
What is your outlook on Copper?
Anonymous · no sign-up · results from the last 30 days · not investment advice