


- Silver closed at $51.88 after a dip to $49.
- Support $50; resistance $53.02 then $57.77.
- Fed hike odds drive the next move.
- 1$53.02 Nearest resistanceResistance has developed in place of support at $53.02
- 2$50.00 Round-number support$50 is the round-number floor and upper buy zone boundary
- 3$48.00 Buy zone floor · SupportLower boundary of the $48 to $50 buy zone; breakdown level
- 4$57.77 Secondary resistanceA close above $53.02 targets resistance at $57.77
- 5$63.00 J.P. Morgan Q4 targetJ.P. Morgan's fourth-quarter objective for silver
- 6$121.67 All-time high · Key levelReached an all-time high of $121.67 on January 29th
TradingView Lightweight Charts™ · Yahoo Finance data
This past year was not kind to silver. On January 29th, it reached an all-time high of $121.67. As of last Friday, it was trading for $51.88, which represents a decline of over 50 percent from the earlier peak. According to CNBC, silver dropped below $50 several times during this time frame as well. Is this a great buying opportunity or a trap? Below is a chart that may help you determine.
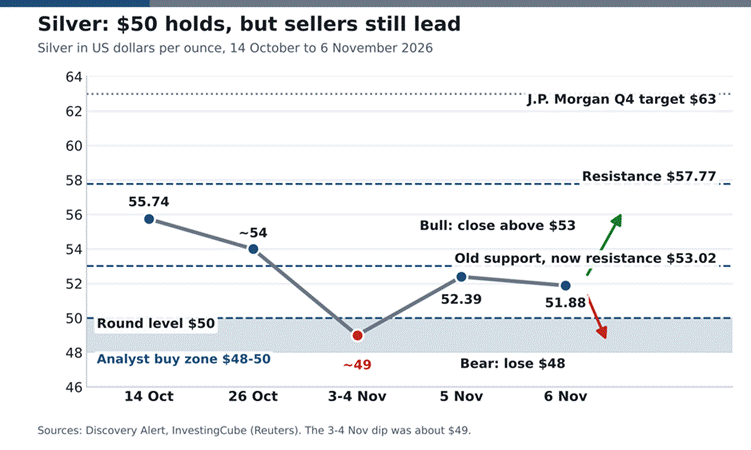
Figure 1: Silver price and key levels in steel grey and blue. Data as of 6 November 2026.
What the Chart Shows
The grey line should be followed from left to right. On 14 October, silver closed at $55.74. Silver reached approximately $54 by 26 October. After that time period, silver dropped significantly to approximately $49 on 3 and 4 November; this drop is indicated with a red dot. Buyers appeared and drove the price of silver back up to $52.39 on 5 November. Silver closed at $51.88 on 6 November. Analysts have identified a “buy zone” represented by a blue box that exists between $48 and $50. Resistance has developed in place of support at a dashed line of $53.02. Resistance will continue to develop at a dashed line of $57.77. J.P. Morgan’s fourth-quarter objective for silver is represented by a dotted line of $63. It should be noted that price reversed direction when it reached the blue box. While buyers do enter the market at around $50, the rebound did not exceed $53.We covered these levels in our silver price prediction for 2026 to 2030.
Why Silver Is Under Pressure
Rates are the big story. Traders put a 75% chance on a Fed hike in December. Strong US data on 14 October hit silver hard. It fell 6.29% that day. Higher rates hurt silver because it pays no interest. The 3 November midterm vote added to the nerves. Oil adds fuel. Our report on silver down 3.5% showed how $112 oil lifted Fed hawk talk. Track the odds on the CME Fed Watch tool.
Supply and Demand
There is good news for bulls. Metals Focus expects an average of $72.60 for 2026. J.P. Morgan sees $70. Both are above today’s price. John Finnick calls $48 to $50 a long-term buy area. The Silver Institute expects a sixth straight yearly supply deficit in 2026. Industry demand is strong, though solar makers may use less silver per panel. India raised its bullion import tax to 15%, which also lifts local prices. For prices in India, see our 3 November gold and silver update.
Gold often leads silver. Our gold price forecast shows what the market watched before US jobs data. The LBMA publishes daily benchmark prices if you want an official reference.

Three Scenarios
- Bullish: a close above $53.02 targets $57.77.
- Bearish: a close below $48 opens deeper losses.
- Neutral: a range between $48 and $53.
Short-term, the Federal Reserve sets the tone. J.P. Morgan predicts $63 per ounce of silver in the fourth quarter. Over the long-term, the supply gap favours buyers; however, price fluctuations will continue to be quite large. Consider the amount of the decline. Silver has lost over half of its value since January. Bulls must exhibit patience. Silver experiences more price volatility than gold. A $1 change in price per day is typical. Keep this in mind when determining trade sizes. Be sure to verify your broker’s pricing as there are discrepancies among data providers. Wait for the market to close rather than entering based on a spike in price. Would you consider buying at these lower levels or wait until silver reaches $53?
Frequently Asked Questions
Why is silver falling?
Rising odds of a December Fed hike lift yields and the dollar, which hurts non-yielding silver. A rebound in oil adds to inflation worries.
What is the key silver support?
$50 is the round-number floor. Some analysts see $48 to $50 as a buy zone.
What is the silver price target?
J.P. Morgan sees $63 in the fourth quarter of 2026. The nearest resistance is $53.02, then $57.77.
What is your outlook on Silver?
Anonymous · no sign-up · results from the last 30 days · not investment advice