



- Nikkei fell 5.96% on 6 November, then bounced 2%.
- Resistance 60,000; support 56,746.
- AI stocks and the yen drive the next move.
- 1¥60,000.00 First resistanceRound number lost since May; close above targets 200-day average.
- 2¥56,746.00 Key floor · SupportNov 6 low and floor of the low zone.
- 3¥62,053.00 200-day average · ResistanceActs as a ceiling and bullish target above 60,000.
- 4¥65,041.00 25-day average · ResistanceKey resistance above the 200-day average.
- 5¥57,435.00 Nov 6 close · Key levelFriday close marking a 5.96% drop into a bear market.
- 6¥61,078.00 Nov 5 close · Key levelClosing level before the nearly 6% Friday decline.
TradingView Lightweight Charts™ · Yahoo Finance data
Japan’s stock market experienced a volatile week. The Nikkei 225 fell by nearly 6 percent on Nov. 6th (the third largest decline in history), and entered a bear market. On Monday, the Nikkei rebounded by approximately 2 percent, according to Reuters. Is this a true rebound, or is this simply a temporary reprieve prior to additional selling? We will examine the chart.
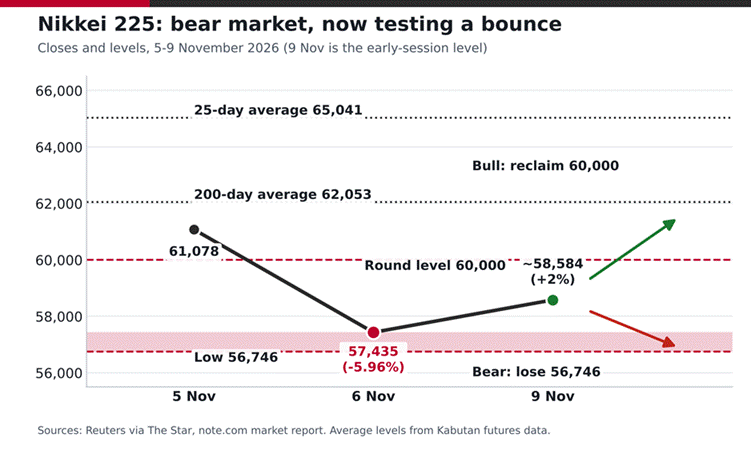
Figure 1: Nikkei 225 closes and key levels in the red and charcoal of the Japanese index. Data as of 9 November 2026.
What the Chart Shows
The first point of the black line was on November 5th when the index closed at 61,078. The next day, the index closed at 57,435, which was a loss of 5.96% from the previous day’s closing price. This is represented by the red dot. On Monday the index traded close to 58,584, represented by the green dot. The pink band located at the bottom of the chart represents the low zone. The floor of this zone is represented by the day’s low value of 56,746. Above the price level there are two dotted lines. The 200-day average is represented by 62,053.
The 25-day average is represented by 65,041. Both are higher than the current price level, therefore, the trend remains downward. Think of the 200-day average as a ceiling. Often rallies in a downtrend will be stopped by this average. TOPIX, the broader index also lost 5.9% on Friday. A rally of 2% after losing 6% is very little. It does not repair the damage. The red dashed line representing 60,000 is the round number that the index lost for the first time since May.
What Hit Japan
AI and chip stock prices were the first to decline. Friday’s trading saw SoftBank drop by 10.8%, Advantest by 5%, and Tokyo Electron by 5.6%. In addition, the weakening yen was no aid to Japanese equities; the U.S. dollar-Japanese yen exchange rate (USD/JPY) increased to 158.47. Only four stocks accounted for approximately 32% of the overall index decrease, demonstrating how dependent the index is upon a limited number of major technology companies.
The pain was global. Our S&P 500 forecast looked at a 4.4% drop in the US index.
Fear also grew that new US election results could bring tighter AI rules. That hurt hopes for data centre spending. Our Nvidia analysis shows $440 billion wiped from the chip giant in one day. For official index data, see Nikkei Indexes.

Is the Bounce Real?
Maybe. President Trump said new strikes on Iran were highly unlikely while talks go on. That helped the mood. Breadth was strong on Monday, with 214 of 224 stocks rising. But analyst Takuma Ikemoto warned gains “could struggle to extend”. Our Nasdaq 100 piece also warned of a dead cat bounce in US futures. Watch the Bank of Japan too. Its next move can swing the yen.
Three Scenarios
- Bullish: a close above 60,000 targets the 200-day average at 62,053.
- Bearish: a close below 56,746 opens a new leg lower.
- Neutral: a range between 56,746 and 60,000.
In the short-term, volatility will continue to remain high. On Friday, the Nikkei VI (the index’s fear gauge) reached 44.60. In the long-term, the downward trend will continue until the price can get back above the moving averages. Chip stress is wide, as our Marvell stock report shows. Track prices and volume at the Japan Exchange Group. SoftBank fell almost 5% again on Monday. Panic often fades very fast, yet a falling market can bounce hard and then drop again. Keep your size small until price proves itself. Will you buy the bounce or wait for 60,000?
Frequently Asked Questions
Is the Nikkei 225 in a bear market?
Yes. After the 6 November fall to 57,434.77, the index sits more than 20% below its June record high.
What is the key Nikkei 225 resistance?
60,000 is the first test, then the 200-day average near 62,053 and the 25-day average near 65,041.
Where is Nikkei 225 support?
The 6 November low of 56,746 is the key floor.
What is your outlook on Nikkei 225?
Anonymous · no sign-up · results from the last 30 days · not investment advice