



- Disney stock has been in a strong rally this year.
- The company will publish its earnings report on Tuesday.
- The options market shows that it has an implied volatility of 77%.
Disney stock has been in a strong rally in the past few months, moving from the year-to-date low of $92.20 in July to the current $118.70. This rally has happened as investors bet that the company’s turnaround efforts are working. Now, the options market is pointing to more volatility after its earnings report today.
Disney Stock to Be Highly Volatile After Earnings
DIS stock will be in the spotlight in the next few sessions as market participants reacts to its earnings report. The options market shows that it has an implied volatility of 77%, much higher than the historical average of 19%. In the past, the stock tends to be moderately volatile whenever the company publishes its earnings.
Looking at the options chain, we see that most of the call options are concentrated at $126, up by 8% from the current level. Also, most of the put options are at $113, much lower than where it is today. Based on volume, the company has more puts than calls, a sign that investors expect the stock to drop.
READ MORE: Baidu Stock Price Near $78 as AI Cloud Sales Jump 94%. Can BIDU Close the Gap to $142?
The most recent results showed that its revenue rose by 7% to $25.2 billion, with its income before income taxes rising by 14%. Its entertainment revenue rose by 6% to $11.34 billion, with its sports and experiences rising by 4% and 10%, respectively.

Yahoo Finance data shows that the upcoming results will show that its revenue jumped 12% to $25.17 billion, a sign that the turnaround is gaining momentum. Its earnings per share are expected to move from $1.11 to $1.68.
A key part of its turnaround strategy is its theme park and cruise divisions, which are doing relatively well despite the challenges in the economy. Its attendance is climbing and the per-capita spending is also rising.
Disney Share Price Technical Analysis
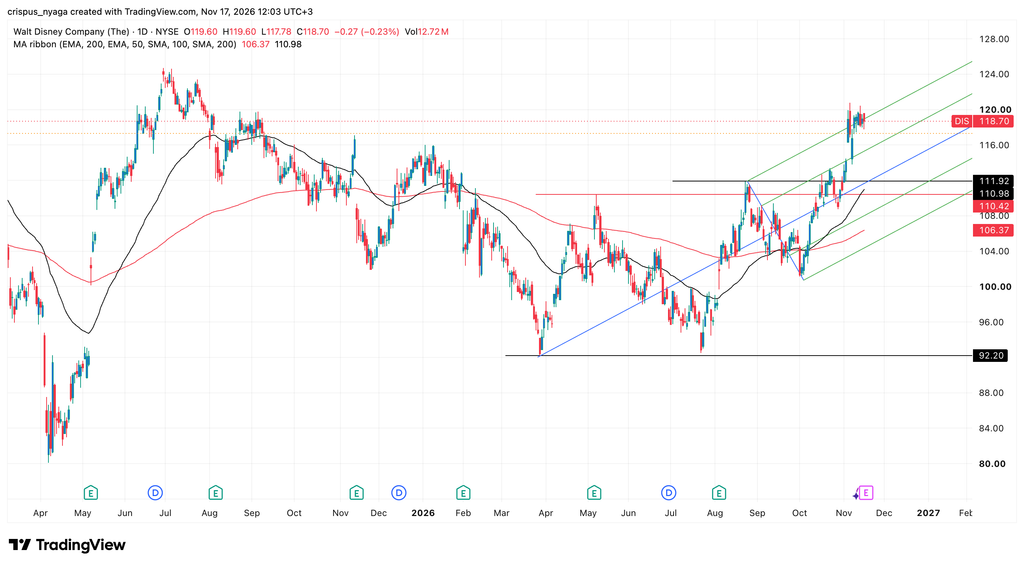
DIS stock chart | Source: TradingView
The daily chart shows that the DIS stock formed a double-bottom pattern at $92.20 and a neckline at $110. This pattern normally leads to more upside over time. It has now jumped above the neckline.
The stock has formed a golden cross pattern as the 50-day and 200-day moving averages cross each other. It has also jumped above the upper side of the Andrews pitchfork tool.
Therefore, the stock will likely pull back, potentially to the key support level of $112. Such a move will then lead to a rebound as investors buy the dip.
What is your outlook on Walt Disney Company (The)?
Anonymous · no sign-up · results from the last 30 days · not investment advice