



- WTI settled at $85.72, just above $85.22 support.
- Bulls need a close above $90; bears target $79.45.
- Supply recovery is the main pressure on prices.
- 1$85.22 First supportOil prices are trading slightly above this first support level
- 2$90.00 ResistanceA daily close above $90 is the initial bullish indication
- 3$83.99 SupportA close below $83.99 opens a bearish path toward $79.45
- 4$92.53 Upper resistanceClearing $92.53 after $90 would show buyers are back
- 5$79.45 Lower supportDownside support target if price breaks and closes below $83.99
- 6$104.00 October high · Key levelPrior peak reached in October before the sharp decline
TradingView Lightweight Charts™ · Yahoo Finance data
Oil Drops Fast
The price of WTI (West Texas Intermediate) crude oil has been having a very bad month. On October 30th, the closing price was over $104 per barrel. On Monday, November 1st, the closing price was $85.72 per barrel, which represents a decrease of 3.2 percent from the previous trading day. This drop in the price of crude oil is due to one simple thing: oil is once again passing through the Strait of Hormuz. According to the International Energy Agency (IEA), there may be a surplus of approximately 1.7 million barrels of crude oil per day at some point during the remainder of 2011.. The U.S. Energy Information Administration also expects lower average prices next year. Let us see what the chart says.
Reading the WTI Chart
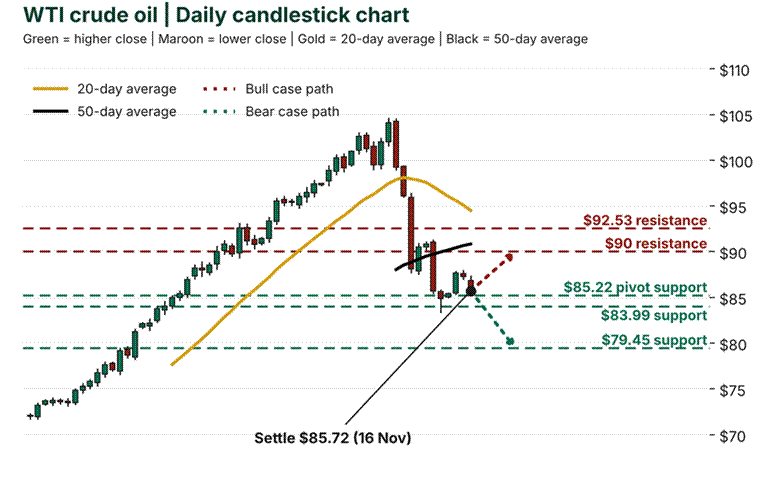
WTI daily chart: resistance at $92.53 and $90, support at $85.22, $83.99 and $79.45. Illustrative chart based on key published levels.
Green candles represent the day oil prices closed higher than previous day’s closing price. Maroon candles represent the day oil prices closed lower than previous day’s closing price. Gold line represents 20-day simple moving average (SMA). Black line represents 50-day simple moving average (SMA). First look at the left-hand side. Oil prices were steadily climbing in an upward stair-step pattern until they reached approximately $104 per barrel. However, since then there has been a significant decline in oil prices which are currently trading below both moving averages. This indicates weakness for oil prices. Maroon dashed lines indicate resistance levels at $90 and $92.53. Green dashed lines indicate support levels at $85.22, $83.99 and $79.45. Oil prices are trading slightly above the first support level. The dotted arrows illustrate the two possible outcomes: a rebound toward $90 or a further decline toward $79.45. Brent shows a similar pattern, as in our Brent price outlook. Use support and resistance levels as zones, not exact lines.
What Is Pushing Oil Lower
Supply is the story. Goldman Sachs expects Brent to average $88 next year and slide toward $78 by December 2027. Traders now talk about a surplus, not a shortage. Yet risks remain. Iran says tankers hit mines near Hormuz this week. When oil topped $110, it hit other markets too, as we saw in silver falling as $112 oil lifted Fed bets. The IEA publishes a monthly report that tracks these supply shifts.
Bull, Bear and Neutral Cases
Bullish case: price closes above $90 and then clears $92.53. That would show buyers are back. Bearish case: price closes below $83.99, which opens $79.45. Neutral case: oil stays between $84 and $90 while traders wait for news. Producer group OPEC can also swing the mood with output decisions. Our study of oil, gilts and global risk sentiment shows how these moves reach stock markets.
Short Term and Long Term
The price of oil may fluctuate by up to five dollars per barrel on any given day due to new developments in shipping or negotiations. These fluctuations will continue until the end of the year. If supply continues to recover, then it is expected that prices for oil will be lower than what is currently forecasted. Traders of gold are also in a “wait and see” mode, similar to traders of oil according to gold price consolidation update. Watch the weekly inventory data from the EIA too. A big stock draw can lift prices fast, while a build can add to the pressure. A firmer dollar usually weighs on oil too. Keep risk small, and use stops.
Your Move
So, will $85 hold, or is $79 next? Watch the daily close, not the headlines. Write your plan before you trade. This is general information, not advice.

FAQs
Why did WTI crude oil fall in November?
Oil flow through the Strait of Hormuz is increasing. The International Energy Agency has predicted that the amount of oil produced will exceed what is consumed by the end of 2012. As a result, oil prices dropped from over $100 per barrel.
What are the key WTI support levels?
I would watch $85.22 before I watch $83.99. If we close under $83.99, it may create a path down to $79.45.
What would turn WTI bullish again?
A daily close over $90 is the initial indication. The second is a test at $92.53.
Is WTI crude a good buy now?
Oil can move quickly due to headline news; therefore, it is best to take smaller position sizes and set stop-loss orders. The above statement is a generalized statement about oil trading and should not be considered as financial advice.
What is your outlook on Crude Oil WTI?
Anonymous · no sign-up · results from the last 30 days · not investment advice