



- USD/ZAR exhibits a bullish moving average formation, however, RSI above 80 indicates overstretched momentum.
- Trend reference lines for the last 20 and 50 days (with their respective average values of 17.2361 and 17.0628) can be utilized to gauge the current direction of the market.
- A pullback does not mean the end of a trend. Use price confirmation to enter trades and use risk management.
InvestingCube chart · Yahoo Finance data
The USD/ZAR has risen significantly, and is now overextended. The daily close of the market could be more significant than the overall trend in prices. The chart below provides a reference for current pricing in relation to nearby technical levels. It can assist you with your decision-making processes; however, it should not be used as an indicator of future performance.
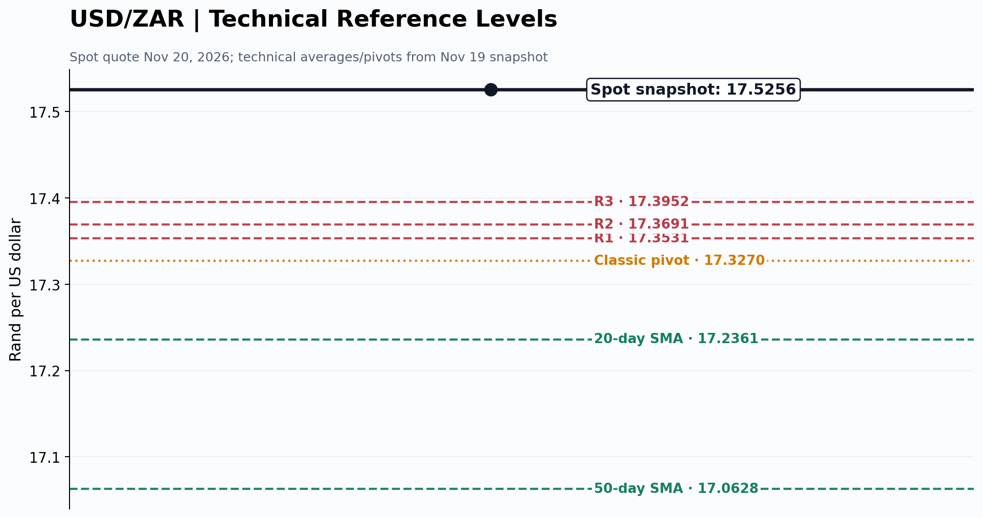
Technical level map · Latest available snapshot
The dollar-rand move has become a risk test
The USD/ZAR pair is a volatile pair that is subject to quick changes based on investor’s risk appetite. On November 20th, the latest market quote indicated that the dollar was worth 17.5256 rand. The pair has increased in value which has caused the rand to decline. In addition to being important to forex traders, this change in value will affect many aspects of South African society including import prices, inflation, travel budgets and businesses that receive income or pay expenses in U.S. dollars.
A stronger U.S. Dollar may represent an increase in U.S. bond yields, an investor’s desire for safety, or a change in focus from emerging-market currencies. On the other hand, the South African Rand is affected by domestic interest rates, commodity prices, public perception of the government, and foreign investment. These factors can push the exchange rate of USD/ZAR in opposite directions. This explains why the exchange rate of USD/ZAR can experience extreme fluctuations, even if there appears to be a clear indication of where the market is going based on a single news story.
The current price action on the chart appears to be extended. While the technical analysis of this pair has shown strength, so too does the momentum indicator which is showing extreme overbought conditions. This produces a difficult trading environment for me; although it is possible that the price continues upward, it is equally possible that there is a sudden and severe pull back in the market that would not affect the overall long-term trend. For traders, you should not rely on an RSI reading as a single indicator for determining when to enter or exit trades.
How to read the USD/ZAR chart
This chart provides a current quote for the currency pair of USD/JPY which has been marked on this chart with a live quote marker at 17.5256. This is in addition to the moving averages and pivot reference values that were recorded on November 19th. As of November 19th, the 20-day Simple Moving Average (SMA) was 17.2361. The 50-day SMA was 17.0628. The Classic Pivot was 17.3270. Resistance levels for the Classic Pivot included 17.3531, 17.3691 and 17.3952. The Classic Pivot represents a previous day’s map for the currency pair of USD/JPY; however, as shown by the live quote marker, the current quote for the currency pair of USD/JPY is above the Classic Pivot.
The fact that the price is above its moving average indicates a positive (bullish) trend. All of the moving averages are aligned in a manner that supports the bullish trend, with the short-term moving averages above the longer-term moving averages. This alignment may reflect long-term purchasing activity. The pair is currently trading significantly above its 20-day moving average. The gap between the price and the moving average should be considered when assessing the current state of the market. A pull back towards the area defined by the moving averages does not necessarily signify a break in the trend.
The chart reference lines may be used to plan out your trading strategy. If the price returns towards the 17.3270 level it will test the previous pivot point. All of the resistance levels above the pivot were based on data from the last trading day. They are no longer relevant as potential target areas because the price has already gone past those levels. It is recommended that traders create new levels using the next day’s high, low and close.
Overbought momentum calls for discipline
The technical snapshot showed an RSI (14) reading of 83.087. This is significantly higher than the typical 70 overbought level. The MACD was in positive territory, while the moving average summary was extremely bullish. These indicators suggest that price action has had significant upward momentum. Additionally, these same indicators indicate that some investors are buying after experiencing large gains.
An overbought condition does not necessarily indicate that the currency pair will decrease. For instance, in an upwardly trending market, the RSI may remain high for an extended period of time. However, a better question to ask is if the price continues to reach new highs and if its pullbacks are minor. Therefore, a daily closing price that falls short of a nearby swing low may be more significant than one RSI reading dropping.
The 20-day average provides a snapshot of how healthy a trend is. A 50-day average offers a wider perspective. When price drops, however, and remains above both of these averages, there is still the potential that the bullish structure will remain. However, if price closes below both of these averages and the momentum has slowed down significantly, the market could possibly be transitioning from a trend to a range-bound environment or even a corrective phase.
Why the rand is sensitive to global conditions
South Africa is tied to the price of commodities around the world. As such, the value of exports from South Africa (as well as investor confidence) will be affected by changes in commodity prices such as precious metals and industrial materials. Higher commodity prices should help bolster the value of the rand, whereas lower commodity prices could have a negative impact. There are other factors that determine whether high/low commodity prices will result in a stronger/weaker rand, such as the exchange rate of the U.S. dollar, interest rates in South Africa, and investors’ willingness to take on risk globally.
The next factor driving the Rand is the U.S. Federal Reserve Monetary Policy. When Treasury yields rise, there will be more money moving into dollars which will cause the rand to weaken against the dollar. Conversely, when Treasury yields decline, the Rand will receive a boost. Traders should look at the Fed’s messages, inflation data, and job reports instead of just looking at one event. If there is an unexpected change in monetary policy, it could lead to rapid price adjustments.
Local developments are as important as international developments.
The policy decisions made by the South African Reserve Bank, inflation expectations, fiscal announcements and growth prospects can all impact the value of the rand. An improved local interest rate environment could result in increased demand for the rand; however, high interest rates can indicate that there is some form of economic distress. Always keep the overall picture in mind when reading headlines.
Recent USD/ZAR coverage on InvestingCube examined the 16.80 barrier and the rand’s technical setup in its USD/ZAR technical-analysis update.
Readers can also compare emerging-market currency pressure with the USD/INR outlook, where foreign flows and central-bank intervention are important drivers.

For a broader risk backdrop, the recent gold outlook shows how changing yields and dollar direction can influence commodities and cross-asset positioning.
Three scenarios to map out
Bullish USD/ZAR: The pair is holding above its moving average cluster and closed above its previous swing high for the second time in two days. This suggests that there will be continuous buying pressure on the U.S. Dollar. Also, U.S. interest rates will continue rising, and there is less investor confidence in emerging market assets. Therefore, it is possible that the bullish momentum will persist, however, investors need to establish a stop-loss point and not chase a very fast rise.
Bearish USD/ZAR: The South African Rand is getting stronger because of better market risk appetite, support from commodities, and/or a weaker U.S. Dollar. The Rand was able to break below its last major swing low (support) and now appears headed for the 20-day simple moving average (SMA) located at 17.2361. If the Rand continues down toward the 50-day simple moving average (SMA) located at 17.0628, this could indicate that there is a bigger correction underway. Please note that the 20-day and 50-day simple moving averages are reference levels and not necessarily where the price will end up.
Neutral USD/ZAR: The price has slowed down after a large rally, and is now within the latest swing high and moving average bands. The RSI is dropping but the price is not falling significantly, which should allow the market to digest existing positions while waiting for the next major economic release. A breakout from this trading range will likely be more telling than trying to trade all of the intraday swings.
Risk management when volatility expands
The USD/ZAR is susceptible to gaps in trading activity surrounding major economic data releases and central bank policy decisions. In addition, there is a risk of a stop loss as filled at a level other than where you placed it in the event of high volatility. It is therefore important for traders to take this into account when determining the amount of risk they wish to accept. By taking smaller positions, traders will find themselves better able to withstand the day-to-day fluctuations of the market, as opposed to those fluctuations become major events in their portfolios.
The indirect effects of currency exposure are another factor to consider. Many South African investors have indirect exposure to foreign currencies through their holdings in foreign shares, import-linked companies, and funds that invest in U.S. dollar-denominated assets. An increase in the value of the U.S. dollar could lead to higher costs for some companies and increase the rand-equivalent value of U.S. dollar-denominated assets. Rather than automatically assuming that every change in currency values is either positive or negative, investors should assess the overall net effect.
The three-part sensible plan includes selecting a level where the thesis is invalidated, determining how much you are willing to lose prior to entry into the market, and avoiding increasing your size in a losing position just because the price is moving away from your trade. You should also keep a calendar handy as inflation data, central bank meetings, and other major US releases may alter the rate of movement of a currency pair rapidly.
What to watch next
The first thing that will determine if the pair stays in the uptrend is if the price of the pair remains above its moving average reference lines. The uptrend remains valid as long as the pair continues to make higher swing lows, however the potential for a pause in the uptrend exists due to the high levels of overbought momentum. Other possible signals that could indicate what direction the pair will go include US Treasury Yields, Commodity Prices, and South African Policy headlines.
A day’s end above a short-term high would provide more validation of the bullish trend than a quick move up. A day’s end below the 20-day simple moving average will necessitate another review of the bullish trend. Investors should consider how changes in foreign exchange rates affect the risk profile of their portfolios. Please do not make trades based upon the appearance of the price action.
The recent InvestingCube technical-analysis article on metals and indices explains how to combine trend, support, resistance and momentum rather than relying on a single indicator.
How to read the next session without chasing
A close above a certain level and then a successful retest of that level will provide the best confirmation for a breakout. If there is a close above a certain level but then a retest fails to hold, this is likely to indicate that the breakout was only temporary. This same principle is useful when looking for a breakdown. If there is a close below a support level and then a subsequent recovery attempt fails to regain the support level, this is more likely to indicate a valid breakdown rather than a brief drop in price due to some economic data release.
A currency pair is the relationship between the value of two currencies. When the exchange rate of USD/ZAR goes up, it means the U.S. dollar has increased in value relative to the South African Rand. However, there are multiple reasons for the increase. The U.S. dollar may have strengthened, the South African Rand may have weakened, or both could have contributed to the increase. To determine what caused the exchange rate to increase, look at the U.S. Dollar Index (USDX), the price of commodities, and other emerging market currencies. This will provide you with additional information to evaluate whether the increase was due primarily to one currency strengthening or weakening.
Do not rely on a trading chart when making a direct currency exchange for a physical payment to ensure that the exchange rate you get is accurate. Banks and other types of payment processors often include additional charges such as spreads and fees. Market quotes are just references; however, the actual exchange rate at which your transaction takes place may differ. Business owners should take into account not only the spot rate, but also their timing and hedging strategies.
FAQ
Is USD/ZAR bullish today? The latest technical snapshot showed a strong-buy moving-average signal, with price above the 20- and 50-day averages. Momentum is high, so trend strength and correction risk coexist.
What levels should traders monitor? The prior technical snapshot included a 17.3270 pivot and nearby resistance references. Since spot has moved above those levels, traders should update levels using the newest daily range rather than treating yesterday’s pivots as current barriers.
Can an overbought RSI lead to a drop? It can warn that the move is a stretch, but it does not forecast a reversal on its own. Confirm with price action, swing levels and a clear risk plan.
What is your outlook on USD/ZAR?
Anonymous · no sign-up · results from the last 30 days · not investment advice