



- Suzlon profit fell 69%; order book above 6 GW.
- Price sits under every moving average.
- Support ₹33.15; first hurdle ₹38.30.
InvestingCube chart · Yahoo Finance data
Suzlon holders have had a rough year. The latest report didn’t help. The wind turbine maker said on 29 October that profit fell 69% to ₹394 crore. Revenue rose 26% to ₹4,869 crore. The shares trade at ₹35.58. That’s close to the 52-week low. Now, time to read the chart closely.
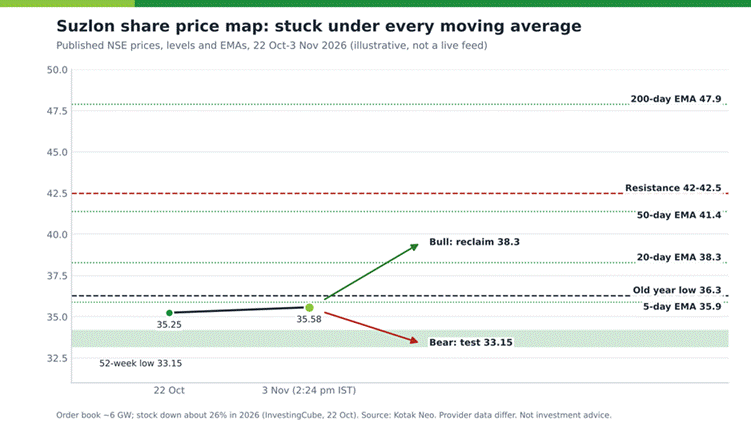
Figure 4: Suzlon share price map in green, built from published NSE prices, levels and moving averages (illustrative, not a live feed).
Reading the Chart
The picture is simple. Price was ₹35.25 on 22 October. It’s ₹35.58 on 3 November. It has gone nowhere. This is what a downtrend looks like. Every moving average sits above it. The 5-day is ₹35.90. The 20-day is ₹38.30. The 50-day is ₹41.40. The 200-day is ₹47.90. The dashed line at ₹36.30 was this year’s low until it broke. Now it acts as resistance. The red line at ₹42 to ₹42.50 is the big ceiling where the stock failed. Our 22 October analysis covered it. The green strip marks the 52-week low of ₹33.15.
What the Numbers Say
Profit is far below last year’s ₹1,279 crore. But it rose 29% from the June quarter. The order book is above 6 GW, Upstox reports. CEO Ajay Kapur pointed to record Q2 deliveries of 710 MW. Sales are growing. Profit is not. That gap matters. So the business is busy while the share price sleeps. That can last a while. Investors wait for profit to catch up with sales. Our 5 October report had already warned of technical pressure.
Where Buyers Could Step In
The stock fell 8.6% in a month and 3.6% in a week, says Kotak Neo. Sellers control every time frame. Don’t guess the bottom. Let price show you. The first sign of change would be a close back above ₹38.30. Our 28 September note asked if ₹38 was the next level. Today the stock is lower. So the question now is whether ₹33 holds.
A Cautious Plan for Traders
Cheap looking stocks in a down-trend are dangerous. A stock trading at Rs 35 is not necessarily a bargain. First, wait for confirmation of an upward move. A close over the 20-day moving average would be a good indication. Do you currently own this stock? Decide on how much of a loss you are willing to accept. If the stock falls below Rs 33, then that would represent a new low. Often times, when a stock makes a new low, it leads to additional selling. Patience does not cost anything.
Long term buyers can take action differently. Make purchases slowly throughout a few weeks. This will reduce your risk of getting caught at the peak. Maintain small positions. Slow steps are much more secure than large risks. Suzlon has gone up 3% to 4% on some days.
Three Scenarios
Bullish: a close above ₹38.30 opens the way to ₹41.40.

Bearish: a break below ₹33.15 would mark a fresh 52-week low.
Neutral: drift between ₹33 and ₹36 while the stock waits for news.
Short term, Suzlon needs a spark. Fresh orders could do it. Long term, our 16 September article called the fall an opportunity. The order book backs that view. But a good story is not a buy signal. The Whalesbook summary is worth a read. Don’t rush. Wait for the chart to turn first. Will ₹33.15 hold? Or will the slide go on?
Frequently Asked Questions
Why is the Suzlon share price falling?
Profit dropped 69% from last year, and the stock trades below all its major moving averages, so sellers have the upper hand.
What is Suzlon’s order book?
The order book is above 6 GW, with record Q2 deliveries of 710 MW.
What is the Suzlon support level?
The 52-week low of ₹33.15 is the key support. Resistance sits at ₹38.30, then ₹42 to ₹42.50.
What is your outlook on Suzlon Energy?
Anonymous · no sign-up · results from the last 30 days · not investment advice