



- The SCHD ETF continued rising and is now at its all-time high.
- The fund is doing well because of its little presence in the AI industry.
- Technicals suggest that it has the momentum.
The Schwab US Dividend Equity ETF (SCHD) is having one of its best years on record and is beating those tied to the S&P 500 (VOO) and the Nasdaq 100 (QQQ). Its total return this year stands at 34%, much higher than VOO’s 11% and QQQ’s 11.2%. This divergence has coincided with the ongoing rush to safety amid the AI bubble jitters.
SCHD ETF is Beating Key Funds on Rotation to Safety
The Schwab US Dividend Equity ETF has done well this year and is hovering at its highest level on record, even as the QQQ remains in a correction.
This performance is happening as investors remain concerned about the artificial intelligence industry. Indeed, a closer look at the worst-performing companies in the S&P 500 and Nasdaq 100 in the last 30 days shows that they are all in the AI space. These firms include popular names like Intel, Marvell Technology, and Lumentum. All these stocks have tumbled by over 30% in the last 30 days.
AI companies have plunged as investors remain concerned about the potential bursting of the AI bubble. Indeed, the AI Stock Bubble Index has jumped to the extreme zone of 74, with top professionals like Ray Dalio and Ken Griffin warning that the bubble may burst soon as interest rates continue rising.

It is against this backdrop that investors have rotated to SCHD, a fund that has little exposure to the AI space. Instead, most of its companies are in healthcare, consumer staples, and energy. They include companies like Procter & Gamble, Coca-Cola, Chevron, and Home Depot.
SCHD Technical Analysis
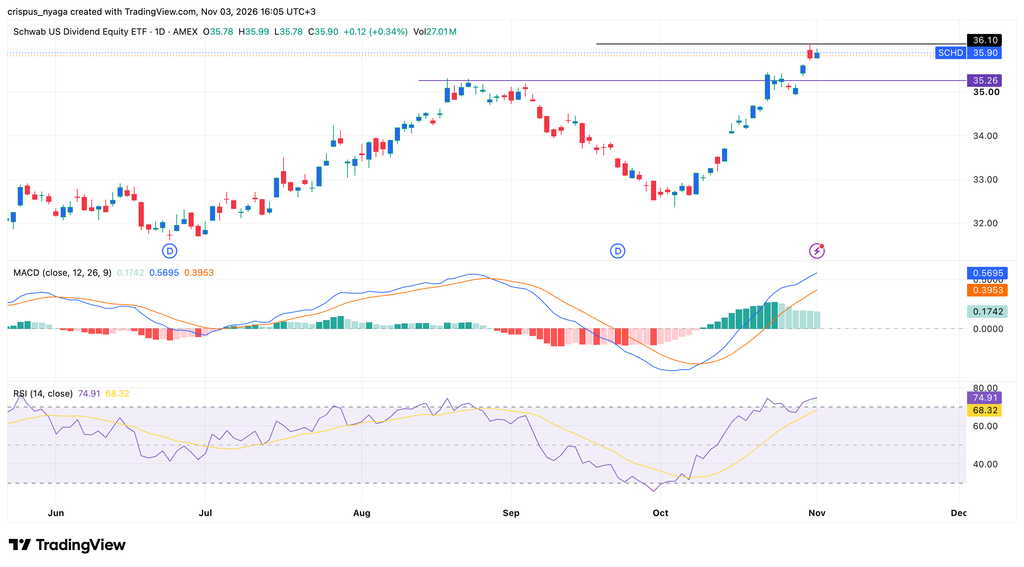
SCHD ETF chart | Source: TradingView
The daily chart shows that the SCHD ETF has some of the best technicals, suggesting that it may continue rising in the near term. It has already moved above the key resistance level of $35.25, its highest level in August this year. Moving above that level was important as it invalidated the bearish double-top pattern.
The Relative Strength Index (RSI) has continued rising and has already moved above the overbought level of 75. Also, the two lines of the MACD indicator have continued rising, a sign that it has the momentum.
Therefore, the path of the least resistance for the SCHD ETF is bullish, with the next important target being at $40. The only caveat is that it may retest the support at $35.25 and then resume the uptrend.