



- Barclays trades near 424p, off its 538p high.
- Support 400p; resistance 430p.
- Q3 profit up 12%; £500m buyback.
InvestingCube chart · Yahoo Finance data
Barclays hasn’t been easy to like lately. The shares sit near 424p, more than 20% below this year’s 538p high, even though third-quarter pre-tax profit rose 12% to £2.3bn and the bank announced a £500m buyback, according to Barclays. So why the gloom? Our death-cross warning put it down to the investment bank. The chart shows how far it has fallen and where the next test sits.
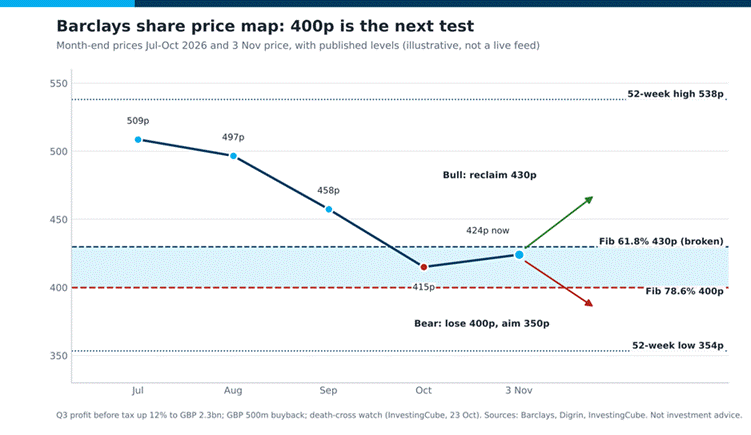
Figure 2: Barclays share price map in Barclays blue, using month-end prices and published levels (illustrative, not a live feed).
What the Chart Shows
Trace the dark line from left to right. Month end prices were 509p in July, 497p in August, 458p in September, and 415p in October. This was a steady stair-down. Since then, it’s climbed back up slightly to 424p according to Digrin. The blue band includes 400p – 430p. The 430p line (a 61.8% Fibonacci retracement) has already been broken. The 400p line (a 78.6% retracement) is the next line to be broken and the 52-week low at approximately 354p is the final floor. Following the red arrow, if we close below 400p then we will likely see prices drop below 350p.
What Is Behind It
The reason why the bank experienced a fall in its stock price is explained by its fundamental performance. Although there was an increase of 47% in the trading of equities, a decrease in fixed income, currency, and commodity trading resulted in the overall revenue growing by only 3% to £7.4 billion. However, management remains confident that the bank will be able to achieve a return on tangible equity greater than 12% in the current financial year. The third quarter achieved a return on tangible equity of 11.7%.
An analyst at Hargreaves Lansdown sees “a more balanced investment case”, with the shares on 6.8 times forward earnings. Back in September, when the BoE froze rates and shares stayed down, BofA also cut its rating to Neutral.
Rates and the Wider Market
Rates matter here. UK inflation of 3.5% has pushed a November hike to about 96% in the price, and higher rates normally widen lending margins, though mortgage competition eats into the benefit. The wider market is jumpy too. In our FTSE 100 technical review, banks fell on private-credit worries just as the index failed again at 10,890.
A Practical Game Plan
If you decide to go long (buy) on a stock, you may want to consider scaling into your position. Traders will often divide an order into two parts – one at 430p and one at 400p. This allows them to get a lower entry point on the stock if the Fibonacci levels don’t hold, but it also reduces their average profit margin. Keep in mind that the death cross is a lagging indicator. It confirms that the stock has hit a new low based on the previous chart patterns, however it does not predict that the stock will continue to make new lows. No matter which option you choose, write down the price that would prove your thesis incorrect prior to entering the trade. Then, use that price to determine how large of a position you should take. Don’t allow a single negative news story to ruin a trading plan you developed when you were calm.
Three Scenarios
Bullish: a close above 430p targets the 458p September close.

Bearish: a close below 400p aims for 350p.
Neutral: chop between 400p and 430p until the next catalyst.
In the immediate future, Thursday’s Bank of England decision and the “death cross” watch will drive market sentiment. In the longer term, the CET1 target of 13% – 14% and £15 billion+ of returns expected between 2026-2028 support the value case.
If dividends matter to you, weigh gilt competition, which we covered in FTSE 100 dividend yields. Is 400p the floor, or a pause on the way to 350p? Settle your risk before the bounce shows up.
Frequently Asked Questions
Why is the Barclays share price falling?
Weakness in the Fixed Income Trading division, as well as concerns about Investment Banking, combined with a Death Cross formation, offset a 12 percent increase in third-quarter profits.
What is the key Barclays support level?
400p, the 78.6% fib retracement level. If closed below this level, I see 350p as the next possible price target which is close to the 52-week low.
Did Barclays announce a buyback?
Yes. Barclays announced that they would be buying back £500m of shares when they released their 3rd quarter results on October 22nd, 2026.
What is your outlook on Barclays?
Anonymous · no sign-up · results from the last 30 days · not investment advice