



- SoFi stock gapped higher on Tuesday after the company published its earnings.
- The company’s revenue and profits continued growing in the third quarter.
- The management expects the revenue growth will continue.
SoFi stock gapped higher on Tuesday after the fintech company published strong financial results. It jumped to a high of $16.50 on Tuesday, its highest level since September 25, and by nearly 20% from its lowest level this year. This rally may continue in the foreseeable future as the company’s growth accelerates.
SoFi Stock Jumps After Strong Earnings
SoFi Technologies has been one of the top laggards in the fintech industry this year. After peaking at $32.74 in November last year, it has slumped to the current $16.40.
SoFi’s shares have plunged despite its strong performance, helped by new product launches and the ongoing surge in the number of users.
Its growth was confirmed last quarter, when its revenue jumped by 44% to $1.4 billion, with its adjusted EBITDA growing to $470 million.
READ MORE: HSBC Share Price is Nearing a Death Cross Despite its Stock Buyback News
The company’s total deposits jumped to $51 billion, up by $5.8 billion from the same period last year. Most notably, it continued launching more products, including SoFi Crypto, SoFi Pay, SoFi USD, SoFi Coach, big business banking, and SoFi Tech Solutions. These products have helped it to boost its fee-based revenue, which now accounts to 42% of the revenue.

The company now expects that its revenue and profits will continue to grow. Its adjusted revenue is expected to grow by 40% this year to $5.04 billion. Its adjusted EBITDA is expected to jump by 57% to $1.66 billion. Its previous guidance was for its revenue to be between $4.7 billion and $4.85 billion.
Therefore, SoFi stock has slumped this year because of a short-seller report that alleged the company inflated its business. SoFi denied those allegations and has continued to launch new products. Still, even so, the company has a high short interest of 25%, a sign that investors expect the stock to drop.
SoFi Stock Price Technical Analysis
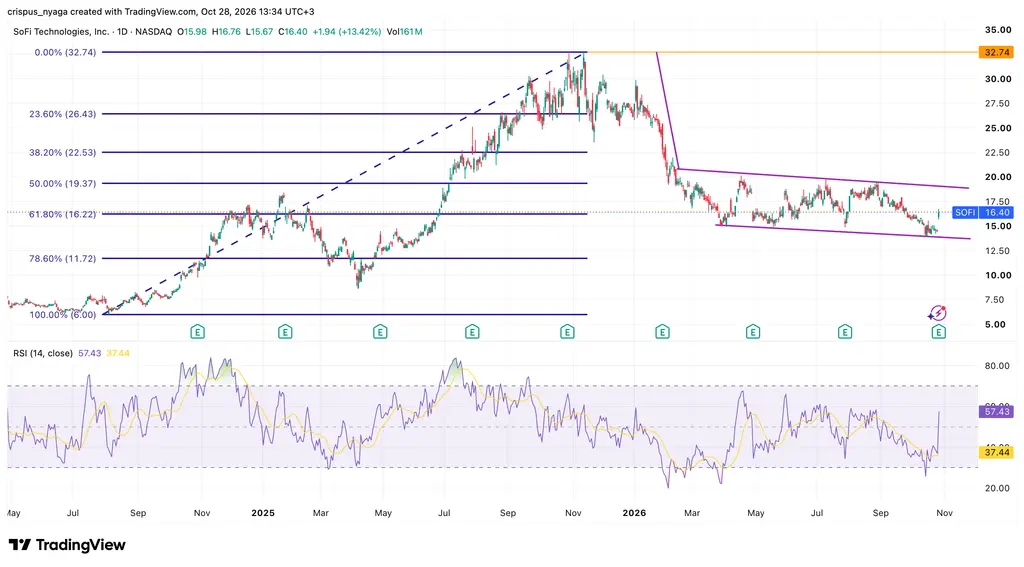
SoFi share price chart | Source: TradingView
The daily chart shows that the SoFi share price surged to $16.40 after releasing its financial results. Before the rebound, it had dropped below the important support level of the 61.8% Fibonacci Retracement level.
The stock has jumped above the lower side of the descending channel. Also, the Relative Strength Index (RSI) has jumped above the neutral level of 50 and is pointing upwards.
SoFi’s consolidation happened after a big drop, a sign that it has formed a bearish flag pattern. Therefore, the stock may resume the downward trend, potentially to the key support level of $10. This view will be confirmed if it drops below the lower side of the channel.
READ MORE: Palantir Stock Near $200 Ahead of November 2 Earnings as US Growth Faces Test