



- Lloyds share price has dropped by 20% from its highest point this year.
- The stock has also formed a death cross pattern on the daily chart.
- It is also forming an inverted cup-and-handle pattern, pointing to more downside.
InvestingCube chart · Yahoo Finance data
Lloyds share price has dropped into a bear market as investors rotate away from European banks. It has slumped from the year-to-date high of 117.80p to the current 95.35p. This sell-off may continue as the stock has formed a death cross pattern.
Lloyds Bank is Falling Despite Strong Metrics
The ongoing Lloyds Bank stock retreat is happening as investors dump other European banks. For example, in Germany, Deutsche Bank and Commerzbank have dropped by over 10% from their year-to-date high.
Unicredit has dropped from the year-to-date high of €86.37 to the current €74. Other European banks like HSBC and Barclays have all retreated this month.
Lloyds Bank published relatively strong earnings last week, with its net interest income rising by 3% YoY to 3.8 billion pounds. Its total net income rose by 2% to £5.7 billion, with the statutory profit after tax rising by 9% to £1.7 billion.
The company’s revenue is benefiting from the ongoing interest rates in the United Kingdom, which have remained at an elevated level this year. Analysts expect the bank to hike rates by 0.25% on Thursday this week.
The management believes that it will hit the annual guidance of getting over £14.9 billion in net interest income. It also expects to end the year with a CET1 ratio of 13% from the current 13.3%.

Lloyds has dropped after the UK government announced an increase in bank corporation tax surcharge from 3% to 6%, lower than the expected increase to 9%.
Lloyds Share Price Has Formed a Death Cross Pattern
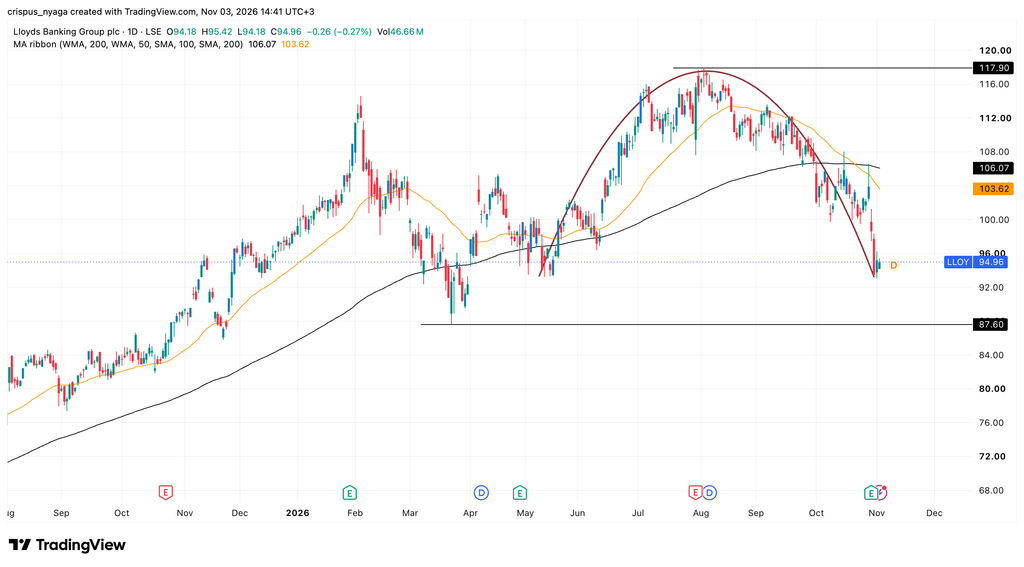
LLOY stock chart | Source: TradingView
The stock has been in a strong downward trend in the past few months and this performance continued after its earnings report last week.
A closer look shows that the stock has already formed a death cross pattern as the 50-day Weighted Moving Average (WMA) moved below the 200-day WMA. This pattern normally leads to more downside over time.
It is worth noting that the stock is yet to form this pattern on other types of moving averages such as the Exponential and smoothed, but the spread is narrowing.
The stock is slowly forming an inverted cup-and-handle pattern, which is a common bearish continuation pattern in technical analysis.
It has also slumped below the Supertrend indicator and the Ichimoku cloud. It has formed a bearish flag pattern, which often leads to a continuation.
Therefore, the stock will likely continue falling, potentially to the key support level of $87.60, its lowest level on March 23.
What is your outlook on Lloyds Banking Group?
Anonymous · no sign-up · results from the last 30 days · not investment advice