


- AMD beat estimates; Q4 guide about $17 billion.
- Key levels: $550 resistance, $505 support.
- Record high is $649.42; targets average $664.
InvestingCube chart · Yahoo Finance data
AMD had a big night. It posted record third-quarter revenue of $13.4 billion, up 45% from last year. It also said next quarter should bring about $17 billion. The stock jumped about 8% after the bell. Nice news. But the stock had been sliding for weeks. So look at the chart first.
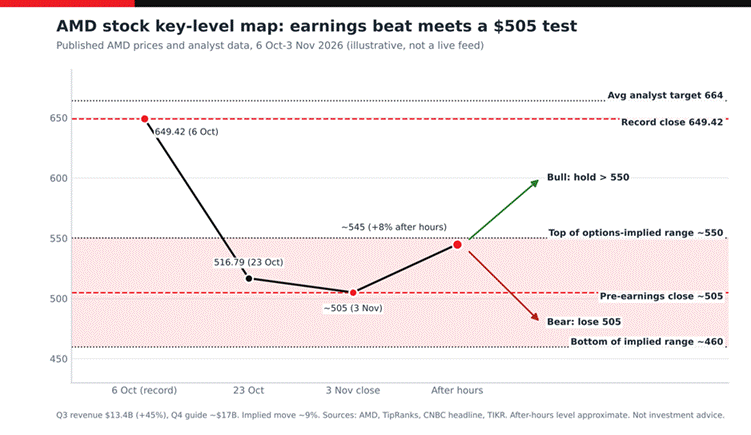
Figure 1: AMD key-level map in the company’s red and black, built from published prices and analyst data (illustrative, not a live feed; after-hours level approximate).
Reading the AMD Chart
Start on the left. AMD closed at a record $649.42 on 6 October. Then it fell fast. It lost 8.1% on 22 October alone and ended at $516.79 the next day. By 3 November it sat near $505. That is my own estimate from the options data. The pink band runs from about $460 to $550. Options traders expected the stock to land there after earnings. After hours it rose to about $545. That is the top of the band. The dotted line at $550 is the first wall. The record is far above it. Remember when Apple fell 4% despite an earnings beat? A good report doesn’t promise a rally.
Why the Numbers Looked Good
Data center sales nearly doubled to $8.5 billion. That’s up 97%. Profit per share was $2.09. Analysts wanted $1.95, says TipRanks. Client and gaming sales fell 8%. So it wasn’t all good news. CEO Lisa Su said demand for Instinct and EPYC chips “continued to strengthen.” Chip stocks are moving on big deals right now. See our Lumentum forecast.
Levels That Matter
Wall Street likes AMD. Susquehanna lifted its target to $650. Jefferies kept $650. The average target is $664.31, reports CNBC. Those targets sit near the record. Targets are guesses, though. They can change fast. For you, $550 is the line to beat. $505 is the line to guard. A close above $550 would turn a bounce into a trend. Check the wider market too. Our Dow Jones forecast helps.
A Simple Game Plan
Earnings gaps are usually short-lived. Do not purchase when price spikes first. Give the market an hour to determine whether or not price will remain above $545. If you already hold the stock, know at what point you would sell if price drops below $505. If you do not yet own the stock, make a small purchase, not a large one. Place alert levels at both $550 and $505. Let the chart develop before making any decisions. Patience is key in this situation. Most traders who lose money on earnings day do so because they rushed into a trade.
Three Scenarios
• Bullish: a daily close above $550 opens the road toward $600.
• Bearish: a close below $505 puts the $460 area in play.

• Neutral: choppy trade between $505 and $550 as buyers digest the news.
Expect to see a roller coaster ride in the near-term. AMD has averaged a 11 percent move following each of its last four earnings reports. In the long-term, the company’s $17 billion outlook indicates that the AI story will continue to grow. However, the stock is up more than 125 percent this year. Therefore, many positive aspects are already priced into the stock.
. Read the earnings call transcript before you trade. For another big name at a key level, see our SpaceX forecast. Will AMD hold $550? Or will profit-taking win? Nobody knows where it goes next. Plan for both sides. Pick your stop before the market opens.
Frequently Asked Questions
Why did AMD stock jump after earnings?
AMD beat revenue and profit estimates and guided to about $17 billion in the fourth quarter, above what analysts had expected.
What is AMD’s record high?
AMD’s record close is $649.42, set on 6 October 2026.
What are the key AMD levels?
$550 is the first resistance, $505 is the pre-earnings level to protect, and $460 is the bottom of the options-implied range.
What is your outlook on Advanced Micro Devices?
Anonymous · no sign-up · results from the last 30 days · not investment advice