



- Reliance rose about 13% in a week to ₹1,310.
- Key hurdle: 200-day average at ₹1,310.70.
- Support at ₹1,265 and ₹1,231.
InvestingCube chart · Yahoo Finance data
Reliance looks different this week. It reported results on 30 October. Since then the shares are up about 13% to ₹1,309.90, says Kotak Neo. A few days ago they sat near ₹1,177 and looked weak. So what’s next? Is this a real turn? Or a quick bounce? The chart has clues. Plenty of readers will ask if it’s too late. Fair question.
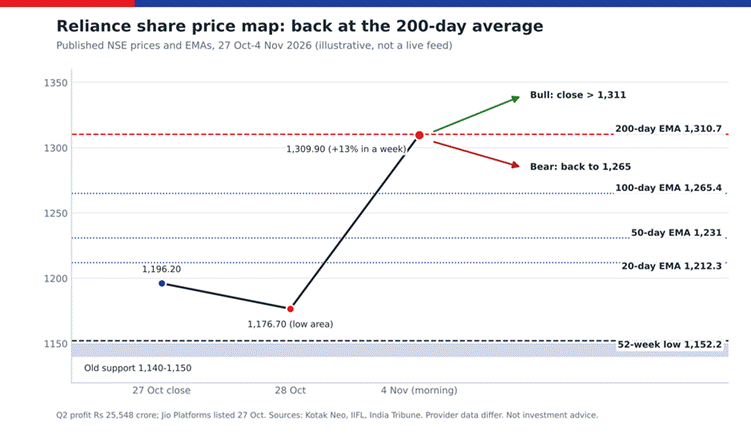
Figure 2: Reliance share price map in blue and red, built from published NSE prices and moving averages (illustrative, not a live feed).
Walking Through the Chart
The black line starts at ₹1,196.20. That was the close on 27 October. It dips to about ₹1,176.70 on 28 October. Then it jumps to ₹1,309.90 on the morning of 4 November. The pale blue strip, ₹1,140 to ₹1,150, was last week’s support. The stock held above it. On the way up, price cleared the 20-, 50- and 100-day averages. Those sit at ₹1,212, ₹1,231 and ₹1,265. Now price sits just under the red dashed 200-day average at ₹1,310.70. New to these lines? That 200-day line is the one to watch. Read our guide to moving averages.
What Drove the Jump
Results did the work. Profit rose 22% from the June quarter to ₹25,548 crore. EBITDA hit a record ₹56,616 crore, says India Tribune. Oil-to-chemicals EBITDA rose 67.9% from a year ago. Crude is still above $100. Check our Brent prediction for the oil level to watch.
The Jio Listing and the Rupee
Jio Platforms listed on 27 October at ₹1,358. That’s 21% above its ₹1,119 issue price, IIFL reported. Reliance fell about 2% that day. So doubt was still around. The results changed the mood. Big listings can shift how people value a group. Watch the rupee too. It moves import costs. Our USD/INR update has the latest range.
How to Plan Your Entry
A stock that has increased by 13% in one week can be an attractive option. However, pursuing that increase can lead to poor results. Consider zones rather than specific prices. Zone 1 is between ₹1,265 and ₹1,311. This zone is where price struggles against resistance. Zone 2 is between ₹1,212 and ₹1,231. This area represents where the shorter moving averages converge. Buyers may return to this area. Waiting until the price falls into zone 2 allows you to place your stop-loss order below zone 2. As a result, if you make a mistake on this trade, it will cost very little. Patience is essential when considering this type of trade.
Also watch volume. When closing above Rs.1,311 with very little volume, this is considered a weak signal. If there has been high volume, then the signal would be stronger. You should make sure you are trading at a size that won’t cause you to lose everything if you have a single losing trade. Most traders lose because they bet too much, not because they selected the incorrect stock.
Three Scenarios
Bullish: a daily close over ₹1,311 removes the final major moving average from the way and brings ₹1,350 into sight.

Bearish: a drop below ₹1,265 suggests a one-week burst, with ₹1,231 next.
Neutral: sideways trade between ₹1,265 and ₹1,311 while buyers rest.
Short term, a pause after a 13% jump is normal. Long term, the stock is still about 19% below its 52-week high of ₹1,611.80. So there’s room. Check the price history before you decide. Oil moves metals too. See our silver price report. One good week isn’t a trend change. Will Reliance close above its 200-day line? Or will sellers show up? Decide before you click.
Frequently Asked Questions
Why did Reliance shares rise after Q2 results?
Profit rose 22% from the June quarter to ₹25,548 crore, EBITDA hit a record, and oil-to-chemicals earnings jumped.
What is the key Reliance resistance level?
The 200-day average near ₹1,310.70 is the first big hurdle, with ₹1,350 as the next round number.
Where is Reliance support?
The first support is ₹1,265, then ₹1,231 and the ₹1,140 to ₹1,150 zone.
What is your outlook on Reliance Industries?
Anonymous · no sign-up · results from the last 30 days · not investment advice