


- SBI profit up 14.3% to ₹23,038 crore.
- Shares faded 1.7% on weak operating profit.
- Watch ₹983 resistance and ₹961 support.
SBI had a strong report on Tuesday. The stock still fell. Standalone profit rose 14.3% to ₹23,038 crore, says IIFL. Yet the shares closed at ₹970.25. That’s down 1.7%. Why fall on good news? The chart shows it.
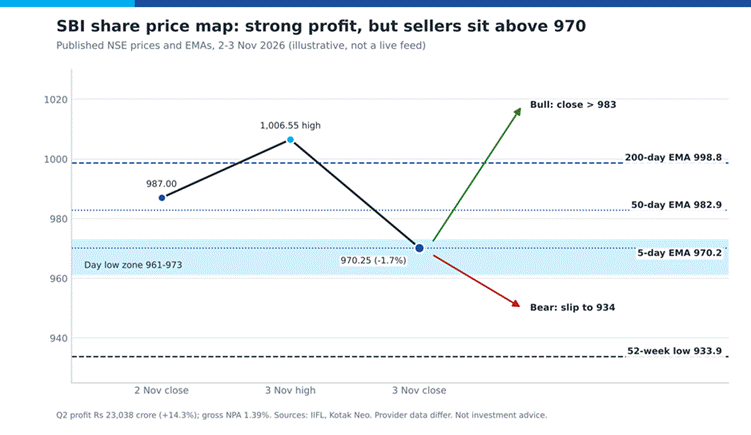
Figure 3: SBI share price map in the bank’s blue tones, built from published NSE prices and moving averages (illustrative, not a live feed).
What the Chart Shows
Follow the black line. SBI closed at ₹987 on 2 November. It spiked to ₹1,006.55 on 3 November. Then it sank to ₹970.25. Buyers pushed early. Sellers took over. Days like this feel unfair. They are common. The light blue band, ₹961 to ₹973, is where the day’s lows landed. The 50-day average at ₹982.90 and the 200-day at ₹998.80 now act like ceilings. The 52-week low of ₹933.90 sits far below. Our swing trading guide shows how to handle a range like this.
Good Numbers, Odd Reaction
Look inside the report. Net interest income grew 14.7% to ₹49,143 crore. The domestic margin rose to 3.11%. Gross bad loans fell to 1.39%. But operating profit slipped 1.4% to ₹26,937 crore. And ₹7,289 crore of profit came from one-off gains. Put simply, the market liked the loans and margin. It wanted stronger core earnings. Kotak Neo shows the stock had already risen 5.6% in a week. Banks face tests everywhere. See our Barclays forecast.
Levels to Trade
The 52-week range is ₹933.90 to ₹1,234.70, per the Kotak Neo price page. Price sits below both big averages. So the trend is sideways to soft. A close above ₹983 would put ₹999 in view. Keep it simple. Wait for a close, not a spike. Day trading it? Know the costs. Our intraday tax guide lists them.
What to Check Next
Three factors are currently important. The first is operating profit; if this can recover, there will be some justification for the stock to increase. Margin is the second factor; a margin of 3.11 percent is good, but a deposit war may cause that to decrease. Finally, loan growth is the third factor. With 17.84 percent, State Bank of India (SBI) is exceeding its own 14 percent to 15 percent target. Loan growth is fine, provided that non-performing assets (bad loans) do not grow too rapidly.
You should keep an eye on the numbers for the next quarter. Also, dividends are important. SBI was able to pay ₹17.35 per share in May 2026. One year ago they were able to pay ₹15.90. The agenda for the results meeting did not include any discussion regarding a future dividend payment. Do not assume that there will be one.
A very basic approach would be to wait for the stock’s price to validate the narrative. If the company has good earnings but a poor technical picture on the daily chart, then the market needs to see evidence that the company is indeed doing well. Once the stock trades above its 50 day moving average (DMA) for several consecutive days, evidence has started to accumulate. Prior to that point, consider each rally back to ₹983 as a “testing” period and not a valid breakout.
Three Scenarios
Bullish: a close above ₹983 reopens the way to ₹999.
Bearish: a slide below ₹961 exposes the ₹934 low.

Neutral: trade between ₹961 and ₹983 until operating profit improves.
Short term, the next move depends on operating profit.
Long term, loans grew 17.84% and bad loans keep shrinking. Nifty Trader’s preview says management guides to 14% to 15% credit growth. So the bank is running ahead. Need a watchlist? Try our stock-picking guide. Is this dip a gift or a warning? Stay calm. No rush. Pick your level first.
Frequently Asked Questions
Why did SBI shares fall after Q2 results?
Operating profit slipped 1.4%, and much of the profit came from exceptional gains, so some investors sold after an early spike.
What was SBI’s Q2 FY27 net profit?
Standalone net profit rose 14.3% to ₹23,038 crore, with gross NPA down to 1.39%.
What are the key SBI share price levels?
Resistance sits at the 50-day average near ₹983 and the 200-day near ₹999. Support is ₹961 and the 52-week low at ₹934.