
Gold price consolidates just below the $2,000 and looks for direction. The market looks for direction from the Fed, as the USD is key when it comes to the next move.
For the last one-and-a-half months, the gold price formed a triangle that can break in both directions. Trading it before a breakout comes is not wise, considering the important events in front of us.
Investors Wait for the FOMC Meeting
One thing to consider is the FOMC Meeting this coming Wednesday. If we consider the last six weeks from the last meeting, we may have an explanation for the gold price consolidation.
The Fed is not expected to deliver any more stimulus at this meeting. However, market participants want to know more details about the average inflation targeting regime at the Fed. More precisely, what is the period that the Fed considers for averaging the inflation close to the two percent target?
U.S. Elections – Another Reason for USD Consolidation
The Fed this week may not break the ranges on the USD. It could very well be that the market consolidates ahead of the main event of the year – the U.S. elections.
November 3rd is not that far away anymore. In less than two months, we will find out if there will be a continuation on the Presidency or not. If yes, the lower USD mantra will continue, as Trump always signaled that he favors a lower USD. If not, the USD may reverse course in light of changes in policies to be brought by the new administration.
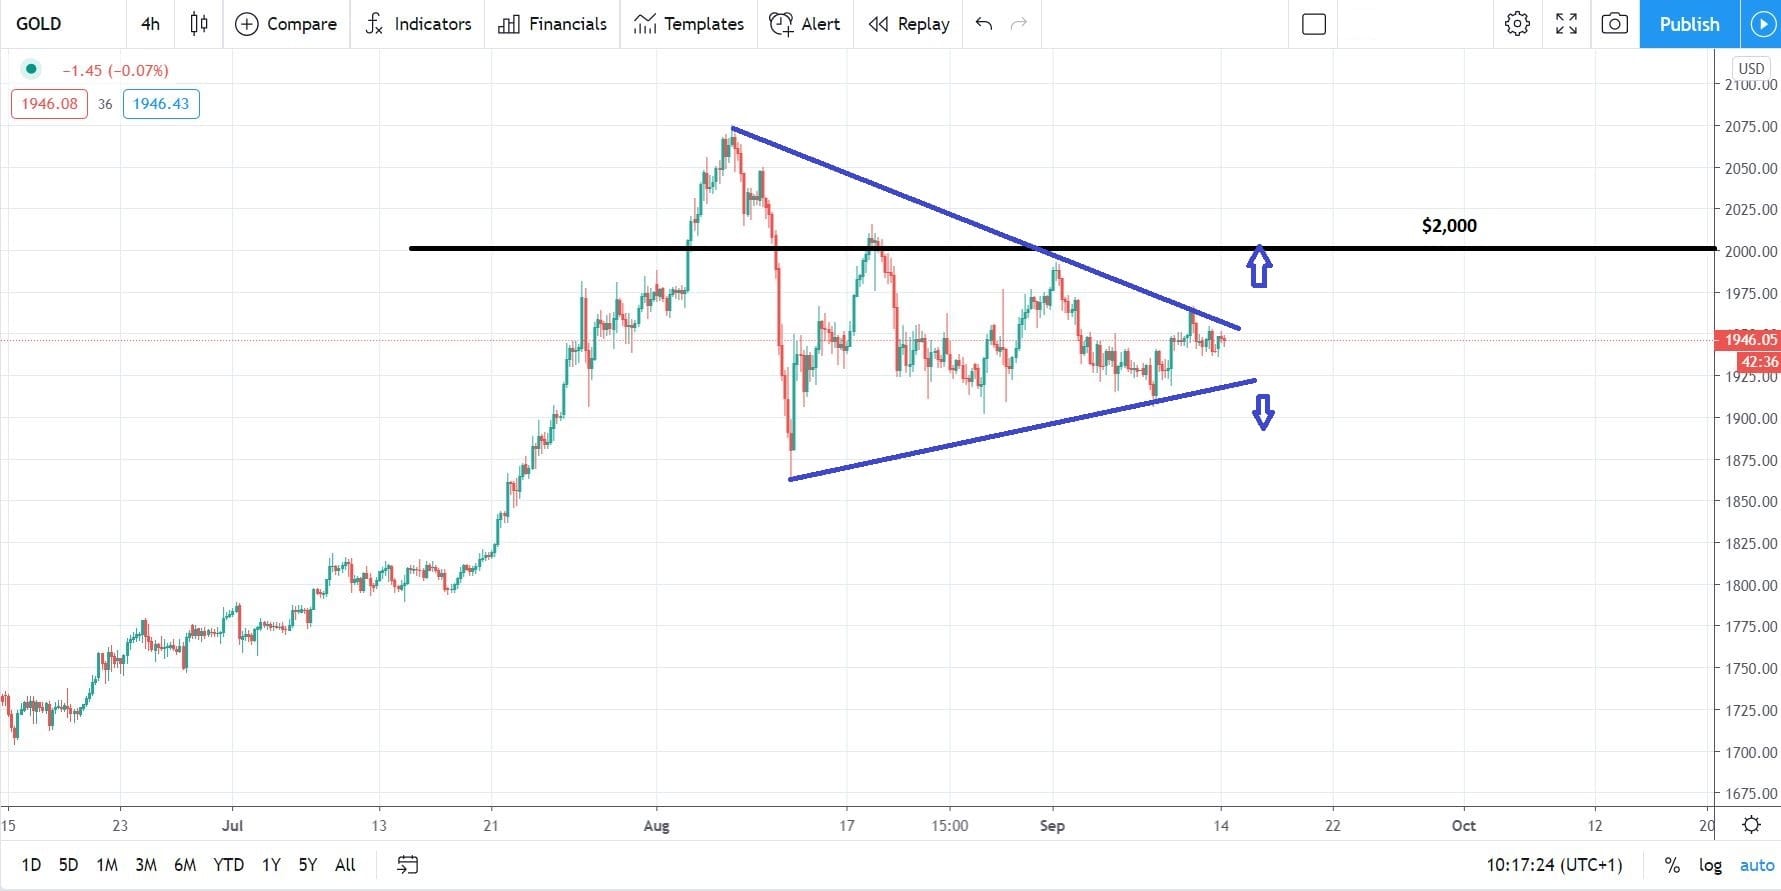
Gold Price Technical Analysis
From a technical perspective, gold price’s consolidation resembles a triangular pattern. It could act as a pennant – a continuation pattern, or as a reversal.
Therefore, the best way to trade it is to wait for the pattern to break. A move above $2,000 signals a bullish outcome, while a move below $1,900 is bearish. In both cases, bulls and bears should consider the measured move (i.e., the longest leg of the triangle) as the minimum target, while having a stop at the last swing lower, respectively higher.
To learn more about alternative investments, consider our trading coaching programs.
Don’t miss a beat! Follow us on Telegram and Twitter.
Gold Price Forecast
More content
- Download our latest quarterly market outlook for our longer-term trade ideas.
- Follow Mircea on Twitter.
- Do you enjoy reading our updates? Become a member today and access all restricted content. It is free to join.