



Current setup:
The Fear and Greed Index measures the degree of investor sentiment, risk appetite,e and market psychology. It is measured on a scale of 0 to 100, with values closer to 0 indicating more fear and values closer to 100 indicating market greed. Fear here means risk aversion, while greed measures risk-associated sentiment. The Fear and Greed Index is typically used to gauge how fairly priced the stock market is, especially during geopolitical turmoil or after a major global risk event (such as a pandemic).
Recent US data shows the Fear and Greed Index has improved after cooler US PCE inflation data. But ahead of today’s Non-Farm Payrolls, the index suggests investors prefer to remain somewhat cautious rather than fully embrace risk.
The Fear and Greed Index is an important measure because it measures market psychology, which drives trader behavior. It does not measure price action.
What is Driving the Current Sentiment on the Fear and Greed Index?
1. Elevated Treasury Yields
The US 10-year Treasury yield surged to a 24-year high after breaching a 19-year high. After hitting 5.342% on 1 October, it has retreated to 5.243% in the hours before the September Non-Farm Payrolls report. This surge in US 10-year bond yields creates a restrictive valuation environment for stocks, especially high-duration technology stocks on the Nasdaq 100 index.
2. Geopolitical and Energy Risks
The Middle East conflict took yet another dramatic turn with the attempted hijacking of an aircraft within the week. Added to the ongoing conflict on several fronts and restrictions on oil shipping across the Strait of Hormuz, the situation remains uncertain for oil supply and inflation. Higher energy prices raise manufacturing input costs, gradually suppressing growth expectations. This also increases pressure on central banks to keep interest rates restrictive.
3. Fed Policy Uncertainty

The latest Core PCE Price Index data was cooler than expected, taking some immediate inflation pressure off the table at a time when an October rate hike looked done and dusted (as per initial September calls by Goldman Sachs and other institutional investors). The data has clouded the expectations for the October meeting somewhat and even Goldman Sachs has pushed its previous Oct rate hike forecast to December. Today’s Non-Farm Payrolls data should provide more clarity.
4. Equity-market Positioning
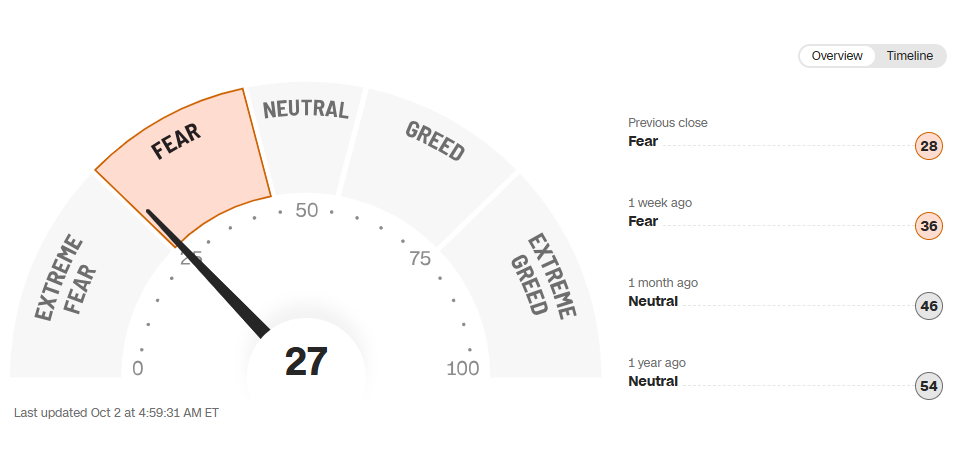
The Fear & Greed index reading as of 2 October (prior to the NFP data release) is 28/100. This indicates that investors are still in risk-off positioning. The NFP could push the reading into more fearful territory (<28) or signal a move toward more risk-on positioning.
Trading the Fear and Greed Index
The Fear & Greed Index is not a standalone buy/sell indicator and should never be used as such. Instead, use it as an additional confirmation tool. For example,
Fear + falling yields + improving market breadth = potential risk recovery
Fear + rising yields + worsening market breadth = risk-off sentiment continuation
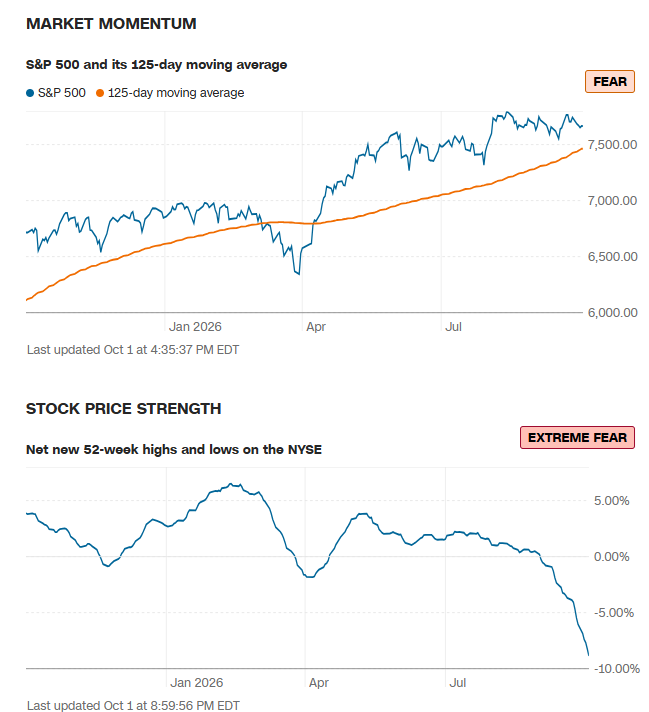
The absolute value at any point in time is not usually the major marker. Rather, the change in sentiment over time as depicted by shifts from Fear → Neutral → Greed (risk-on) or from Greed→Neutral→Fear (risk-off) are better determinants of market movement based on shifts in sentiment, alongside the underlying macro data.