




Current Setup
Bias: bullish USD/INR.
The Indian Rupee is currently trading at 2-month lows versus the US Dollar, as continued foreign portfolio outflows hit the Indian equities market. Traders are now focusing on the Reserve Bank of India’s interest rate decisions scheduled for Wednesday 7 October, with the markets pricing in a rate hike by the RBI in response to imported inflation linked to higher oil prices.
As predicted, the Rupee’s decline continues to be managed via USD sales from the RBI and state-owned banks. In addition, we are seeing USD/INR sell and buy swaps, designed to mop up excess rupee liquidity and absorb excess cash ahead of Wednesday’s decision. A poll of economists reveal an expectation of a 26 bps rate hike, with a modest outside potential of a 50 bps increase. If implemented, this will be the first rate hike in 44 months. Investors are also expected to watch policymakers’ remarks for guidance on the future monetary policy trajectory.
USD/INR is trading around 96.41 and remains above the psychologically important 96.00 mark, where several RBI interventions took place.
USD/INR Macro Drivers
1. US Treasury Yields remain a major headwind
The US 10-year Treasury yields are still flirting with 20-year highs around 5.34%. Such high yields make USD-denominated assets more attractive than emerging-market currencies such as the rupee, which are typically high-risk and subject to unstable volatility. High US bond yields are a major headwind and part of why the rupee’s weakness has extended beyond the 96.00 price mark.
2. Brent Crude
Brent crude may have eased to $98 intraday, but the fact that it still trades close to $100 continues to drive higher energy import costs for the Indian economy; a rupee-negative scenario. India’s heavy dependence on imported crude makes it vulnerable to elevated oil prices, worsening the trade balance and pressuring the rupee through higher dollar demand.
Higher oil prices → ↑ India’s dollar demand → INR weakness → ↑USD/INR
3. RBI Intervention
The RBI continues to intervene in the foreign-exchange market, either directly or in conjunction with state-run Indian banks. This continues to prevent any outsized, disorderly rupee weakness. The issue traders face now is that the 96.00 ceiling used for recent interventions has been breached. Traders need confirmation of a new price benchmark, and until it is provided, going long on USD/INR is essentially a gamble.

4. Importer Hedging
Indian importers reportedly placed currency hedge positions worth $77 billion in September, an 80% YoY increase and an all-time monthly high. This clearly shows that currency volatility risk for Indian corporate entities is immense, and they are taking active steps to hedge against further depreciation, given that the rupee has lost 6.5% of its value to the USD year to date.
5. RBI Policy Meeting
The RBI’s next monetary-policy decision is due on 7 October. Market consensus points to a 25 bps rate hike to 5.50%, with an outside chance of a 50 bps hike to 5.75%. Any hawkishness from the RBI is not expected to radically strengthen the rupee amid the oil shock. However, if accompanied by stronger intervention, we could see a sub-96.00 USD/INR exchange rate in the immediate aftermath of any hawkish activity.
USD/INR Forecast Scenarios
Base case — RBI rate hike/intervention: This keeps the pair from pushing beyond 96.50, but still leaves the pair above 95.70. This range creates an opportunity for two-way volatility as the boundaries straddle the 96.00 key price mark.
Bull case — USD/INR breaks 96.50: A sustained close above 96.50 unlocks access to upside targets at 97.00 and beyond. The trigger for this move is a spike in oil prices towards $110 and US bond yields breaking 24-year highs.
Bear case — rupee recovery: A move below 95.70 ushers in a period of retracement, with targets below 95.30 coming back into the picture. A material decline in Brent crude toward $90 strengthens this case.
Technical Outlook
The USD/INR is currently testing the ascending trendline that previously served as support until it broke on 25 September. It is now resistance, and price is testing this barrier. A break of this trendline and the overhanging 96.96 resistance brings in the 98.23 price mark formed by the 61.8% Fibonacci extension of the 9 April – 20 May upswing.
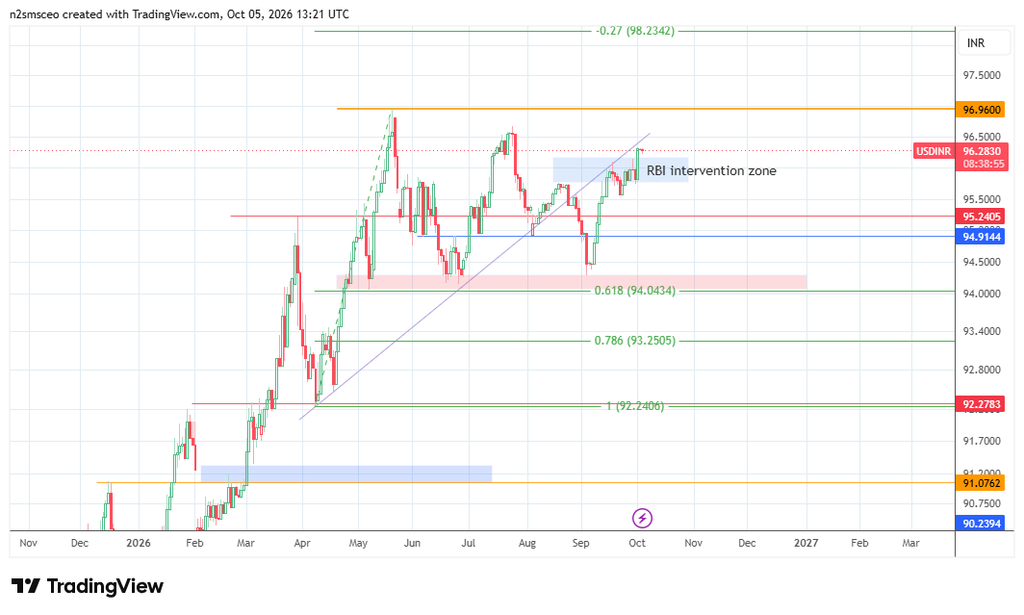
Conversely, rejection at current levels brings 95.24 support into focus. If price breaks down this support, the 94.04 support formed by the 61.8% Fibonacci retracement becomes the next downside target.